Momentum Gains, AstraZeneca Stock Drops 1.04% Today
On September 24, 2026: price 12,430.00 GBp, trend sideways, RSI 62.6, support 11,650.00, resistance 12,672.00. technical analysis of astrazeneca stock.

AstraZeneca shares on the LSE slipped to 12,430.00 GBp on 22 September 2026 at 14:00 WIB, down 1.04% on the day after a recent run that still leaves the stock above both the 20-day and 50-day averages. That matters because it says the pullback is happening inside a broader sideways structure rather than at the start of a clear downtrend, with the price still sitting in the upper part of its recent range. The latest tape, as shown in the chart, suggests a market that is still being bought on dips, but not aggressively enough to break into a fresh trend.
Trend & Price Action
The first signal is the relationship between price and trend lines. AstraZeneca is trading above SMA20 at 12,124.20 and above SMA50 at 12,189.24, which keeps the medium-term structure constructive. There is no new MA cross, so the chart is not giving a fresh trend confirmation either way. Instead, it is showing consolidation: the slope of SMA20 is only 0.83% over 5 days, a mild upward tilt that points to stabilization rather than acceleration.
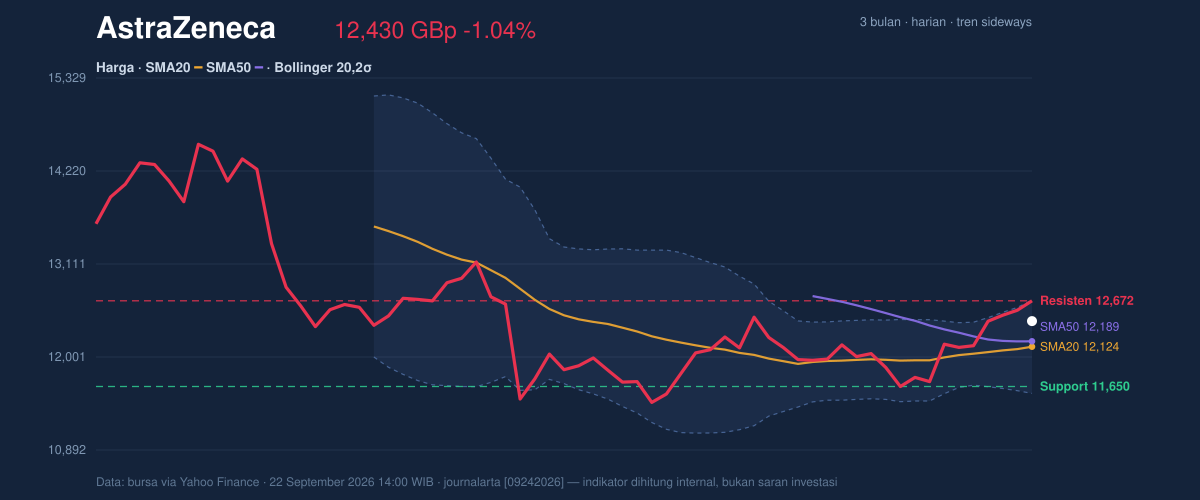
The broader framing is also important. The stock is in a sideways trend, and the current price sits at about 76% of the 20-hour range between 11,650.00 support and 12,672.00 resistance. That positioning tells us buyers have kept control of the upper half of the channel, but the move has not yet proved it can clear the ceiling. The 3-month band, from 9,892.00 to 14,686.00, shows there is still room above current levels, though the market is not behaving as if it wants to test that upper extreme immediately.
Oscillators & Momentum
Momentum is more mixed than the trend lines. RSI at 62.6 is still in neutral territory, which means the stock is not yet technically stretched on that measure. But the stochastic reading is a different story. Stochastic %K at 98.4 and %D at 94.2 are both in overbought territory, which usually means the short-term move has run ahead of itself and may need time to cool. In plain language, the stock has been rising fast enough over the immediate past that it may pause even if the larger trend remains intact.
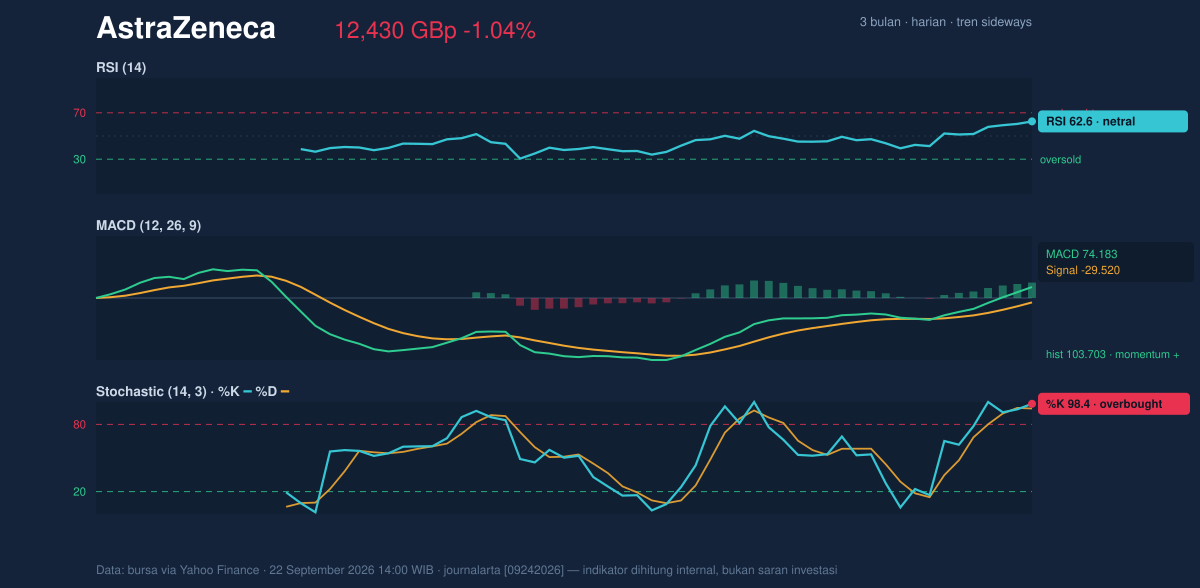
The MACD picture is stronger. MACD at 74.183 is above the signal line at -29.520, and the histogram at 103.703 shows positive momentum is still expanding. That combination matters because MACD is often used to gauge whether a move has internal strength. Here, it says the recent advance still has force behind it, even though the stochastic oscillator warns that the pace may be too hot for comfort. The result is a classic split: trend-following momentum remains positive, while short-term oscillators are flashing caution.
Volatility & Volume
Volatility is not elevated enough to imply disorder, but it is active enough to keep traders alert. ATR at 285.90, or 2.3% of price, indicates moderate daily movement. That is useful because it suggests the stock can travel meaningfully without becoming erratic. The Bollinger Bands reinforce that message. The band width is 9.2%, described as normal, and price is at %B 77%, meaning it is trading closer to the upper band at 12,680.54 than the lower band at 11,567.86. This positioning usually signals strength, but it also implies less room before the market meets technical resistance.
Volume adds a second layer of confirmation. Last volume was 4,821,834, about 1.4× the 20-hour average of 3,334,782. That is not a euphoric spike, but it is enough to say the latest move has participation behind it. The OBV is rising, which is important because on-balance volume tracks whether volume is flowing into the stock as price rises. Rising OBV alongside price above both moving averages usually supports the idea that buyers are still present, even if the chart is pausing near resistance.
Key Levels & Scenarios
The market is now boxed in between clear reference points. Support at 11,650.00 is the first level to watch if the pullback deepens. A failure there would weaken the current sideways base and shift attention toward the lower Bollinger band at 11,567.86. On the upside, resistance at 12,672.00 is the nearest hurdle, closely aligned with the upper Bollinger band at 12,680.54. That cluster matters because it creates a technical ceiling where momentum will need to prove itself.
If price clears 12,672.00 with volume, the chart would signal a stronger attempt to leave the range behind. If it slips back under 12,124.20, the 20-day average, the current constructive tone would begin to fade. For now, the evidence says the stock is still holding its structure, but the overbought stochastic warns that upside may need a pause before any further push.
Technical Verdict: HOLD (wait & see)
HOLD (wait & see)
- Reason 1: Price is still above SMA20 and SMA50, which keeps the medium-term structure intact.
- Reason 2: MACD is positive and the OBV is rising, both signs that buying interest remains active.
- Reason 3: Stochastic is overbought and price is near resistance at 12,672.00, so the chart is stretched in the short term.
- Invalidation: the verdict is invalidated if price breaks below 11,650.00.
- Ideal entry range: 11,650.00 to 12,124.20
- Exit target: 12,672.00 to 12,680.54
- Stop loss protection: below 11,567.86
In plain English: the shares still look supported, but they are close enough to resistance that the next move matters more than the last one.
At 22 September 2026 14:00 WIB, AstraZeneca’s last price was 12,430.00 GBp.
Summary Data AstraZeneca
| Last price | 12,430.00 GBp |
| Change 1 day / 5 days / 1 month | -1.04% / 2.59% / 2.64% |
| Trend / MA-cross | sideways / none |
| SMA20 / SMA50 | 12,124.20 / 12,189.24 |
| RSI (14) / Stochastic %K | 62.6 / 98.4 |
| Bollinger %B / ATR | 77% / 285.90 |
| Support / Resistance 20 days | 11,650.00 / 12,672.00 |
| Data as of | 22 September 2026 14:00 WIB |

