Testing Support Level, HSBC Stock Drops 1.25% Today
On September 24, 2026: price 1,514.60 GBp, trend sideways, RSI 45.4, support 1,503.80, resistance 1,580.20. technical analysis of hsbc stock.

HSBC Holdings (HSBC) fell to 1,514.60 GBp on the LSE, slipping 1.25% from the previous close of 1,533.80 as the shares drifted back below both the SMA20 at 1,536.01 and the SMA50 at 1,531.50. That puts the stock in a sideways pattern rather than a clean uptrend or downtrend, but the message from the tape is cautious: price is trading under short-term averages, momentum is negative, and volume is not yet showing the kind of participation that usually confirms a rebound. The chart also shows the shares sitting near the lower half of the recent range, with Bollinger Bands tightening — a setup that often precedes a sharper move, though not necessarily in one direction.
Trend & Price Action
As shown in the chart, HSBC is still boxed inside a broad range, with the 3-month high at 1,610.00 and the 3-month low at 1,350.00. The current price is closer to the lower end of that band than the top, which matters because it tells traders the market has not yet reclaimed the levels that would signal renewed strength. The 20-hour support at 1,503.80 is now the first line to watch: the share price is only slightly above it, so the market is effectively testing whether buyers are willing to defend the area. On the upside, the 20-hour resistance at 1,580.20 remains the near-term ceiling, and price is still materially below it. The lack of a new MA-cross is important: without a fresh moving-average crossover, the chart is not giving a trend reversal signal, only a pause inside a sideways structure.
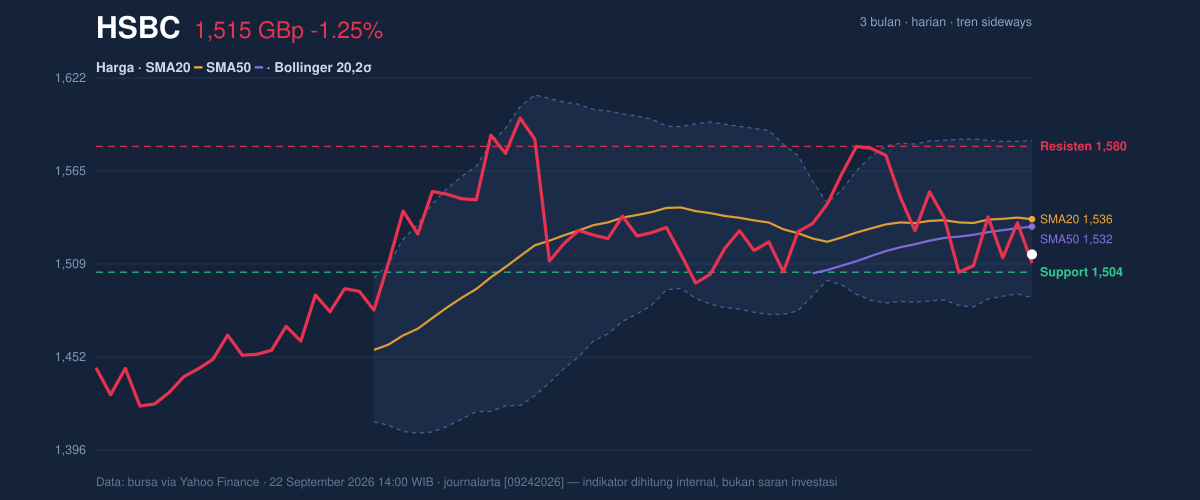
The SMA20 slope of 0.13% over 5 days suggests the short-term trend is flattening rather than accelerating. In plain language, that means the stock is not falling fast enough to call it a clear breakdown, but it is also not building enough upward pressure to call it an advance. The price below the SMA20 is the more telling signal here: in technical analysis, that usually means recent buying has lost control of the tape, even if only temporarily.
Oscillators & Momentum
The momentum picture is mixed, but not in a way that favors immediate strength. The RSI at 45.4 is neutral, which means HSBC is neither stretched to the upside nor oversold on that measure. That matters because a neutral RSI often leaves room for either direction, depending on whether buyers or sellers can force a breakout. The more urgent signal comes from the Stochastic at %K 10.4 and %D 21.3, which is in oversold territory. Oversold does not mean “cheap” in a fundamental sense; it means the share price has fallen enough, fast enough, that short-term selling may be getting tired. But that signal is not confirmed yet because the MACD is negative at -1.913, below its signal line at 2.507, with a histogram of -4.420. That gap shows bearish momentum is still dominant, and the histogram says the downside force is not just present — it is widening.
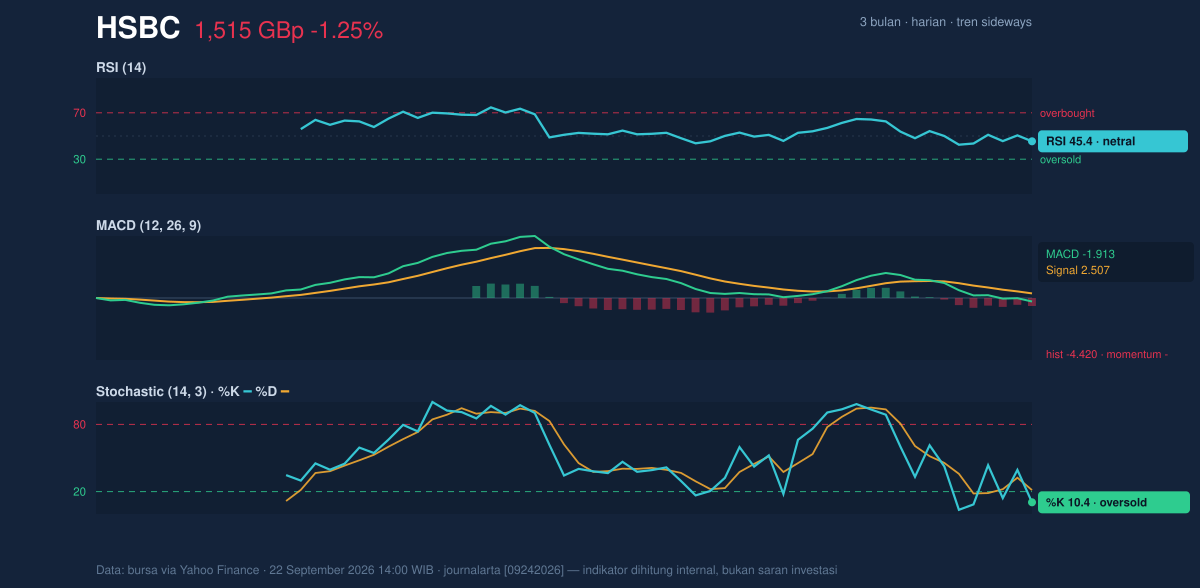
So the oscillators are not aligned. Stochastic is flashing a possible short-term rebound condition, but MACD is still pointing down. That split usually means traders are watching for a bounce, not yet treating one as confirmed.
Volatility & Volume
The Bollinger Bands are tightening, with the band width at 6.2% and price sitting at a %B of 28%. %B below 50% means the share is trading in the lower part of the band structure, closer to the lower band than the middle line. The lower band at 1,488.29 is therefore the next technical cushion if the current support gives way. A squeeze in Bollinger Bands often signals that volatility is being compressed; when that happens, the next move can be abrupt once the market chooses a direction. For now, though, the compression is only a setup, not a breakout. The ATR at 31.34 — about 2.1% of price — says daily movement remains moderate rather than explosive, so the market is tense but not yet panicked.
Volume is not helping the bulls. The latest reading of 15,080,870 is only 0.8× the 20-hour average of 19,671,217, and OBV is falling. That combination matters because a move higher on weak volume is easier to fade, while declining OBV suggests that cumulative buying pressure is not building. In other words, the stock may be hovering near support, but the crowd is not yet stepping in decisively.
Key Levels & Scenarios
The immediate decision point is simple: 1,503.80 support versus 1,580.20 resistance. If price holds above support and starts to recover the SMA50 at 1,531.50 and then the SMA20 at 1,536.01, the chart would begin to look less fragile. If it fails to hold 1,503.80, the market would be exposed to the 1,488.29 lower Bollinger Band, which is the next technical reference visible on the chart. Because the Bollinger structure is squeezing, any move through either side of the range could be swift once confirmation appears.
Technical Verdict: HOLD (wait & see)
HOLD (wait & see) fits best because the chart is mixed: price is below the SMA20 and SMA50, MACD is negative, and volume/OBV are not confirming a rebound, while Stochastic is oversold and Bollinger Bands are tightening, leaving room for a bounce. The signal is not strong enough for a directional call until price proves whether it can reclaim the short-term averages or slip through support.
- Ideal Entry Range: 1,503.80 to 1,531.50, where support meets the SMA50 zone.
- Exit Target: 1,580.20, the nearest resistance level on the chart.
- Stop Loss protection: below 1,488.29, the lower Bollinger Band.
- Verdict invalidated if: price breaks below 1,488.29 and fails to recover.
In plain English, HSBC is sitting at a technical crossroads: weak enough to be cautious, but not weak enough to rule out a rebound.
The latest 3-month low is 1,350.00.
Summary Data HSBC
| Last price | 1,514.60 GBp |
| Change 1 day / 5 days / 1 month | -1.25% / 0.72% / -0.94% |
| Trend / MA-cross | sideways / none |
| SMA20 / SMA50 | 1,536.01 / 1,531.50 |
| RSI (14) / Stochastic %K | 45.4 / 10.4 |
| Bollinger %B / ATR | 28% / 31.34 |
| Support / Resistance 20 days | 1,503.80 / 1,580.20 |
| Data as of | 22 September 2026 14:00 WIB |

