Shell Stock Technicals Today: Gains 2.62%, Momentum Weakens
On September 24, 2026: price 3,580.00 GBp, trend uptrend, RSI 55.5, support 3,311.00, resistance 3,652.50. technical analysis of shell stock.

Shell plc edged higher on the LSE to 3,580.00 GBp on 22 September 2026 at 14:00 WIB, extending a broader uptrend even as short-term momentum stayed uneven. The shares are trading above both the SMA20 at 3,482.38 and the SMA50 at 3,376.84, which tells the market that recent buying has been strong enough to keep the price structure constructive. But the move is not cleanly one-way: the 5-day change is -1.98%, while the 1-month gain is 5.39%, a combination that usually signals a stock that is still trending up but pausing under nearby resistance.
Trend & Price Action
The chart shows Shell sitting in the upper half of its recent trading range, at about 79% of the 20-day range, with the 20-day support at 3,311.00 and 20-day resistance at 3,652.50. That positioning matters because it suggests buyers have already absorbed a good part of the available supply, but the stock has not yet broken decisively into fresh territory. In practical terms, the price is close enough to resistance that traders will be watching whether the current advance has enough force to clear the ceiling, or whether it stalls and rotates back toward the moving averages.
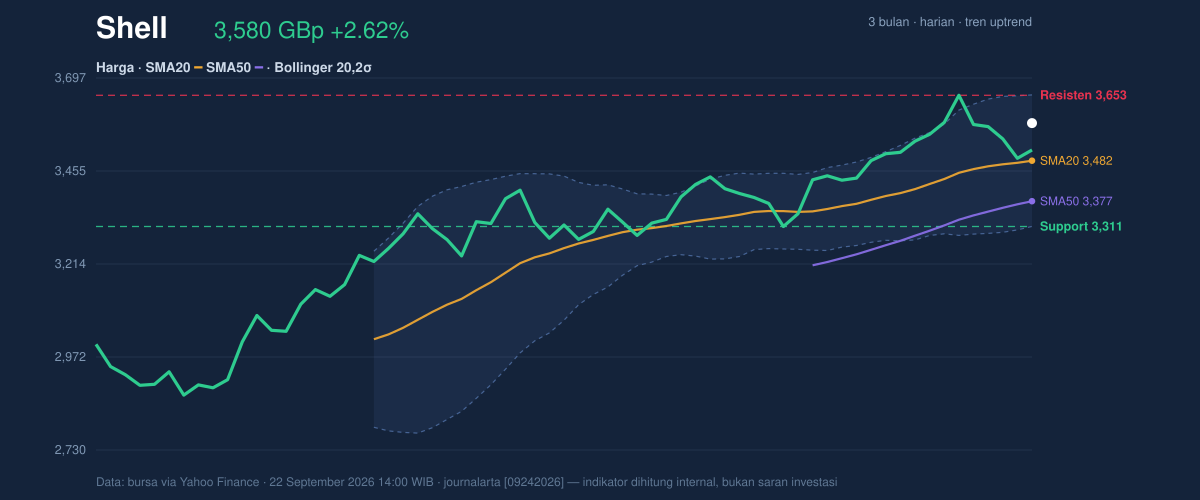
The broader trend remains positive because the SMA20 is rising, with a slope of 0.91% over 5 days, and the share price remains above both short- and medium-term averages. That is a classic sign of trend support: when price holds above a rising SMA20 and a higher SMA50, dips tend to be treated as consolidation rather than outright breakdowns. The absence of a fresh MA cross also matters. It means the market is not getting a new trend signal from the moving averages; instead, the current setup is being carried by the existing uptrend, which is healthy but less explosive than a new crossover phase.
Oscillators & Momentum
The momentum picture is more restrained than the trend picture, and that mismatch is the main signal in this name right now. The RSI at 55.5 is neutral, which says the shares are neither overbought nor oversold and still have room to move in either direction. The Stochastic %K at 44.5 and %D at 45.5 are also neutral, pointing to a market that has cooled from earlier strength without yet tipping into a clear reversal setup.
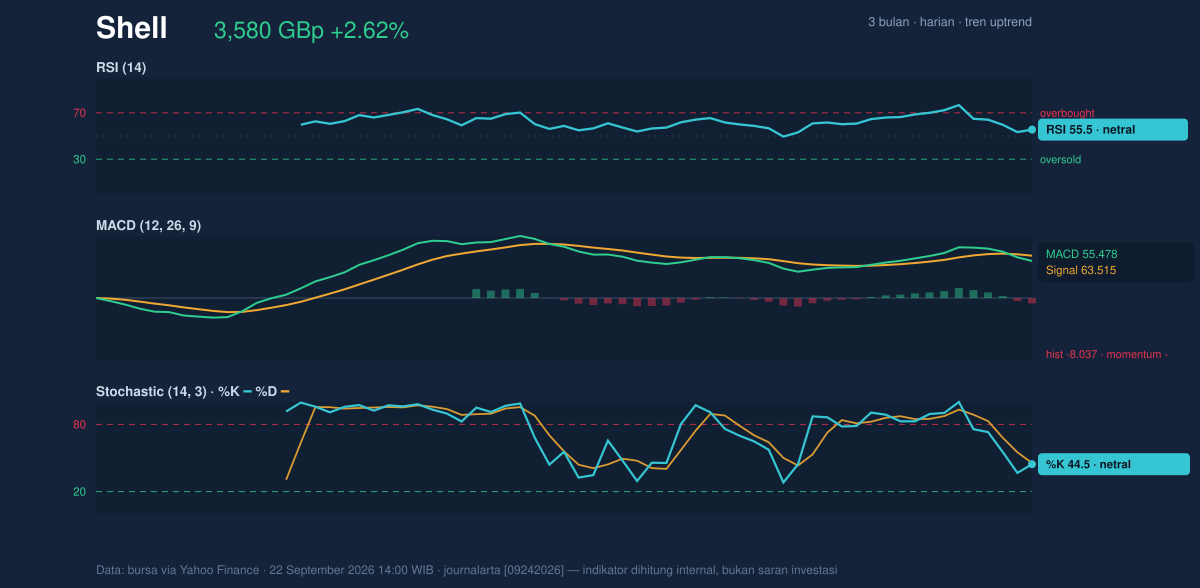
The more important detail is the MACD at 55.478 versus signal at 63.515, with a -8.037 histogram. That negative histogram means short-term momentum is running below the slower trend line, even though the broader price trend is still up. In plain language, Shell is rising on a solid base, but the latest push is not yet backed by strong acceleration. This is often what a stock looks like when it is digesting gains near resistance: the trend remains intact, but momentum needs to improve before the next leg can be trusted.
Volatility & Volume
Volatility is moderate rather than stretched. The ATR(14) at 65.05, equal to 1.8% of price, suggests the shares are moving enough to create tradable swings, but not so violently that the chart is unstable. The Bollinger Bands reinforce that reading. With the upper band at 3,653.44, the middle band at 3,482.38, and the lower band at 3,311.31, Shell is trading above the midline and below the upper band, while %B at 79% shows the price is leaning toward the top of the band rather than the middle. That usually indicates strength, but also leaves less room for error if buyers lose conviction.
The Bollinger band width of 9.8% is described as normal, which means there is no squeeze building for a sharp breakout, but neither is there a volatility expansion warning. Volume adds a useful layer of confirmation. Last trade volume was 10,585,659, just below the 20-hour average of 11,120,015, or about 1.0x normal. That is not a strong breakout volume reading, so the advance is currently being supported more by steady participation than by a surge of new demand. The positive note is that OBV is rising, which suggests accumulated buying pressure has been improving even if the latest session did not come with a dramatic volume spike.
Key Levels & Scenarios
The immediate battle is between the 3,652.50 resistance and the 3,311.00 support. If Shell can push through the resistance area, the chart would confirm that the recent consolidation was a pause within the uptrend rather than a top. If it fails there, the price may drift back toward the SMA20 at 3,482.38, which is the first line of dynamic support. A deeper pullback toward the SMA50 at 3,376.84 would still leave the broader structure intact, but it would show that momentum has weakened more than the trend has.
The 3-month high at 3,663.50 is only slightly above the current resistance zone, which makes this a tightly framed test. The 3-month low at 2,559.50 remains far below, so the long-term range still leaves room for the stock to remain constructive even if it pauses here. What matters now is whether the price can hold above the mid-band and moving-average cluster while momentum repairs itself.
Technical Verdict: HOLD (wait & see)
Shell’s chart argues for HOLD (wait & see) because trend support is still intact, but momentum has not yet confirmed a fresh upside push.
- Reason 1: Trend remains positive — price is above the SMA20 and SMA50, and the SMA20 slope is rising.
- Reason 2: Momentum is mixed — RSI 55.5 and Stochastic 44.5/45.5 are neutral, while the MACD histogram is negative.
- Reason 3: Price is near resistance — the stock is close to the 3,652.50 ceiling and the upper Bollinger band at 3,653.44, where upside needs stronger confirmation.
- Verdict invalidated if price falls below 3,311.00, because that would break the 20-hour support and weaken the current uptrend structure.
- Ideal entry range: 3,482.38 to 3,311.00, where the SMA20 and support zone offer the most visible technical backing.
- Exit target: 3,652.50 to 3,663.50, aligning with resistance and the recent 3-month high.
- Stop loss protection: below 3,311.00, with the SMA50 at 3,376.84 as an earlier warning line.
In plain English, Shell looks steady, but the chart is asking for proof before the next move higher. “The market is still willing to pay up, but it is not yet shouting.”
Summary Data Shell
| Last price | 3,580.00 GBp |
| Change 1 day / 5 days / 1 month | 2.62% / -1.98% / 5.39% |
| Trend / MA-cross | uptrend / none |
| SMA20 / SMA50 | 3,482.38 / 3,376.84 |
| RSI (14) / Stochastic %K | 55.5 / 44.5 |
| Bollinger %B / ATR | 79% / 65.05 |
| Support / Resistance 20 days | 3,311.00 / 3,652.50 |
| Data as of | 22 September 2026 14:00 WIB |

