HSBC Stock Analysis: Gains 0.13%, Momentum Weakens
On Agustus 17, 2026: price 1,527.80 GBp, trend sideways, RSI 52.8, support 1,480.80, resistance 1,597.40. technical analysis of hsbc stock.

HSBC Holdings’ shares were last at 1,527.80 GBp on 14 August 2026 at 14:00 WIB, leaving the stock just below its 20-day average and still inside a broad, well-defined trading band. The price is up 0.13% on the day, but the more important signal is that HSBC remains below its SMA20 at 1,540.32 while holding above its SMA50 at 1,473.72. That positioning usually points to a market that is not trending hard in either direction: buyers are still defending the larger uptrend backdrop, but short-term momentum has not yet regained control.
Trend & Price Action
As shown in the chart, HSBC is in a sideways trend, and the slope of the SMA20 is 0.73% over 5 days, which suggests the short-term average is still inching higher rather than rolling over. That matters because a rising moving average often acts like a slow-moving test of demand: it shows the stock has not lost its intermediate structure even though it is trading below the SMA20. The absence of a fresh MA-cross also reinforces the message that this is a consolidation phase, not a decisive trend shift. The price is sitting around 40% of the 20-day range, which means it is closer to support than resistance, but not so close that the market looks oversold.
That is a holding pattern, not a breakout.
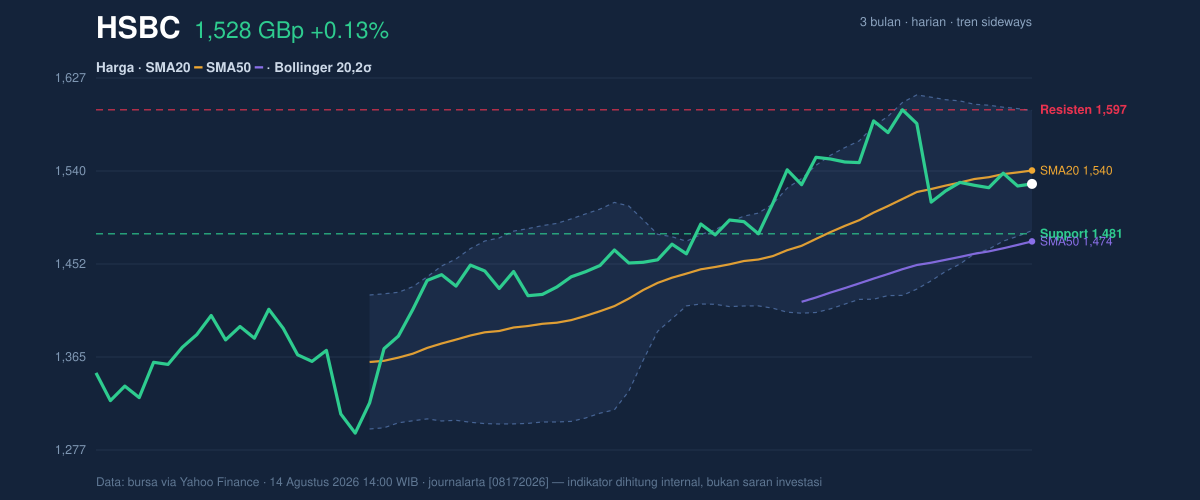
The broader range gives this setup more context. HSBC’s 3-month high of 1,610.00 and 3-month low of 1,267.20 frame a stock that has already recovered a large part of its earlier weakness, but has not yet reclaimed the upper boundary of its recent band. The key message from price structure is simple: the market is respecting the lower half of the recent range, while the 1,540.32 area remains the first level that needs to be reclaimed to shift the tone from neutral to firmer.
Oscillators & Momentum
Momentum indicators are mixed, and that mix is what keeps the picture balanced. The RSI at 52.8 is neutral, which means HSBC is neither stretched nor washed out. The Stochastic %K at 39.2 and %D at 41.2 are also neutral, but they sit below the midpoint, implying the stock has room to recover if buyers step in. The more cautionary signal comes from MACD at 14.570 versus signal at 22.279, with a histogram of -7.708. In plain language, MACD is still below its signal line, so the short-term trend impulse is weaker than the broader price structure would suggest.
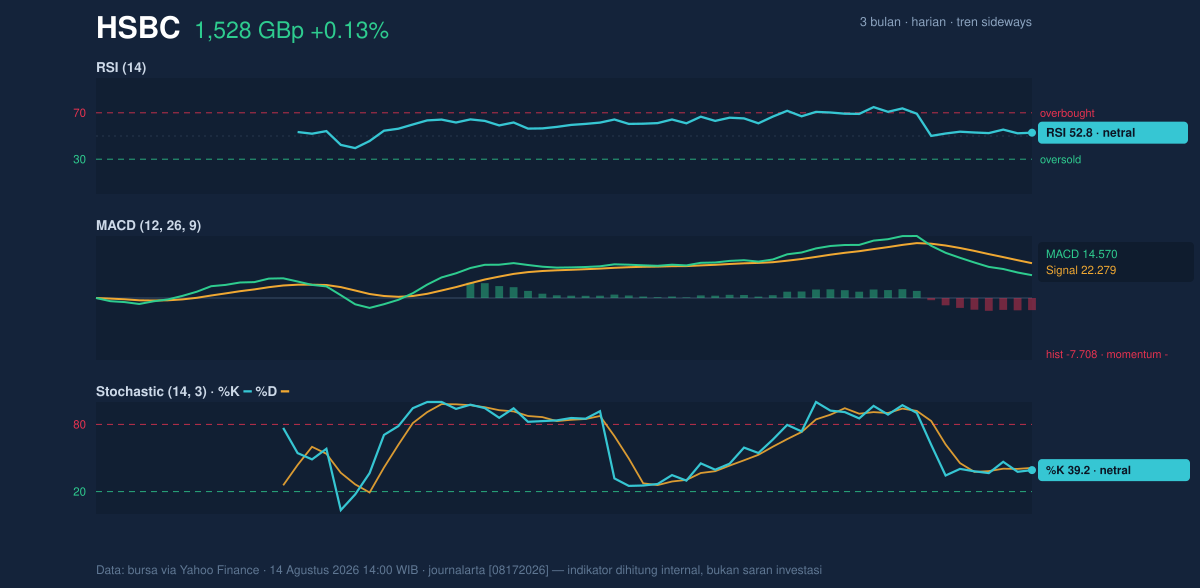
This combination matters because it shows no strong bullish confirmation yet. RSI and Stochastic are not overbought, so there is no immediate pressure from an overheated move, but MACD remains negative, meaning upside attempts still need proof. In technical terms, the stock is trying to stabilise, but the momentum engine has not fully turned back on.
Volatility & Volume
Bollinger Bands add another useful layer. The band width is 7.3%, which is relatively tight and signals a squeeze: volatility has compressed, and compressed markets often precede a larger move. The current price sits with %B at 39%, meaning HSBC is trading in the lower part of the band but not at an extreme. The middle band is the SMA20 at 1,540.32, while the upper and lower bands are 1,596.79 and 1,483.85. That structure says the market is coiling between support and resistance rather than trending freely.
Bollinger compression is the clearest signal on the chart.
Volume is helping the case for participation. Last volume was 42,408,141, or about 1.5× normal versus the 20-day average of 28,934,607, while OBV is rising. OBV, or on-balance volume, tracks whether trading flow is leaning toward accumulation or distribution. A rising OBV alongside above-average volume tells us the market is still seeing net buying interest, even if price has not yet broken out. That divergence between improving participation and muted price momentum is often what appears before a level test.
Key Levels & Scenarios
The first support to watch is 1,480.80, which is close to the lower Bollinger band at 1,483.85. That overlap makes the area technically important: if HSBC slips through it, the stock would be losing both a chart floor and a volatility boundary at the same time. On the upside, 1,597.40 is the immediate resistance, sitting just under the 3-month high of 1,610.00. A move through that zone would not just be a higher price; it would signal that the squeeze is resolving in favour of buyers and that the stock is challenging the upper part of its recent range.
Support at 1,480.80 and resistance at 1,597.40 are the two levels that define the next move.
ATR(14) at 35.13, or 2.3% of price, indicates moderate volatility. That is important because it suggests any breakout or breakdown may not be a slow drift; the stock has enough daily movement to travel meaningfully once a direction is chosen. Until then, the setup remains a compressed range with mixed momentum and improving volume.
Technical Verdict: HOLD (wait & see)
HOLD (wait & see)
- RSI at 52.8 and Stochastic at 39.2/41.2 are neutral, so momentum is not strong enough to confirm a clean directional move.
- MACD is negative with the histogram at -7.708, which argues against calling the short-term trend fully repaired.
- Bollinger Bands are squeezing and OBV is rising, which suggests a move may be building, but price has not yet cleared the key trigger at 1,540.32.
Verdict invalidated if price breaks below 1,480.80.
- Ideal Entry Range: 1,483.85 to 1,540.32, using the lower Bollinger band and SMA20 as the main technical zone.
- Exit Target: 1,597.40, with 1,610.00 as the broader range cap from the 3-month high.
- Stop Loss protection: below 1,480.80, since that would lose the nearest support and the lower band area.
In plain English: HSBC is not weak, but it has not yet proved that the next move is up.
HSBC’s latest 20-day support sits at 1,480.80 and resistance at 1,597.40.
Summary Data HSBC
| Last price | 1,527.80 GBp |
| Change 1 day / 5 days / 1 month | 0.13% / -0.09% / 2.39% |
| Trend / MA-cross | sideways / none |
| SMA20 / SMA50 | 1,540.32 / 1,473.72 |
| RSI (14) / Stochastic %K | 52.8 / 39.2 |
| Bollinger %B / ATR | 39% / 35.13 |
| Support / Resistance 20 days | 1,480.80 / 1,597.40 |
| Data as of | 14 Agustus 2026 14:00 WIB |


