BP Stock Gains 0.10% Today, Momentum Weakens
On Agustus 17, 2026: price 522.90 GBp, trend sideways, RSI 49.7, support 514.90, resistance 555.90. technical analysis of bp stock. BP Stock Gains — full…

BP plc is trading in a narrow, defensive range, with the market weighing a still-soft short-term trend against signs that sellers may be tiring. The shares last changed hands at 522.90 GBp, up 0.10% on the day, but the bigger message is that BP remains below its near-term average even as trading activity has jumped.
Trend & Price Action
The stock is moving sideways, and that matters. A sideways trend usually means the market has not committed to a sustained direction: buyers are present, but not strong enough to force a clean breakout, while sellers have also failed to drive the price into a deeper decline. BP is currently trading below its SMA20 at 532.96, which signals that the latest bounce has not yet reclaimed the short-term trend line. At the same time, it remains above the SMA50 at 511.90, so the medium-term structure has not broken down.
That split between the two moving averages is important. It suggests BP is stuck between short-term weakness and medium-term support, a classic consolidation setup. There is no new MA-cross, so the chart is not flashing a fresh trend reversal signal. The SMA20 slope is 0.76% over 5 days, which tells us the short-term average is still edging higher, but only gradually. In plain language: the trend is trying to improve, but it has not yet won the argument.
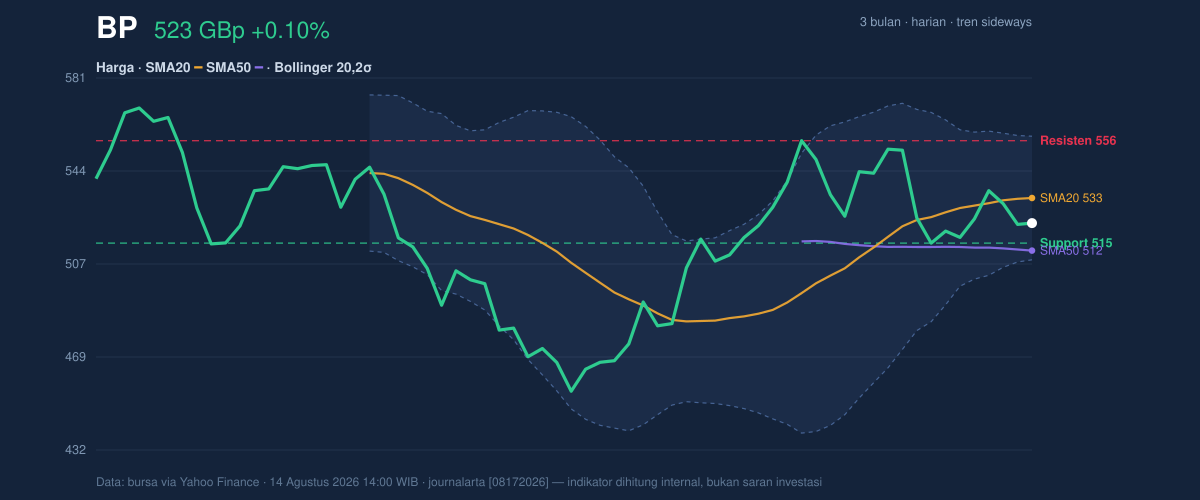
The price is also sitting near the lower half of its recent range. The 20-hour support is 514.90 and resistance is 555.90, while BP is trading close to the lower end of that band. That positioning usually means the market is waiting for a catalyst. The broader 3-month range, from 450.60 to 575.70, shows there is still room for either direction, but the current move is not yet strong enough to challenge the upper end.
Oscillators & Momentum
Momentum is mixed, and the chart shows why the recent price stability should not be mistaken for strength.
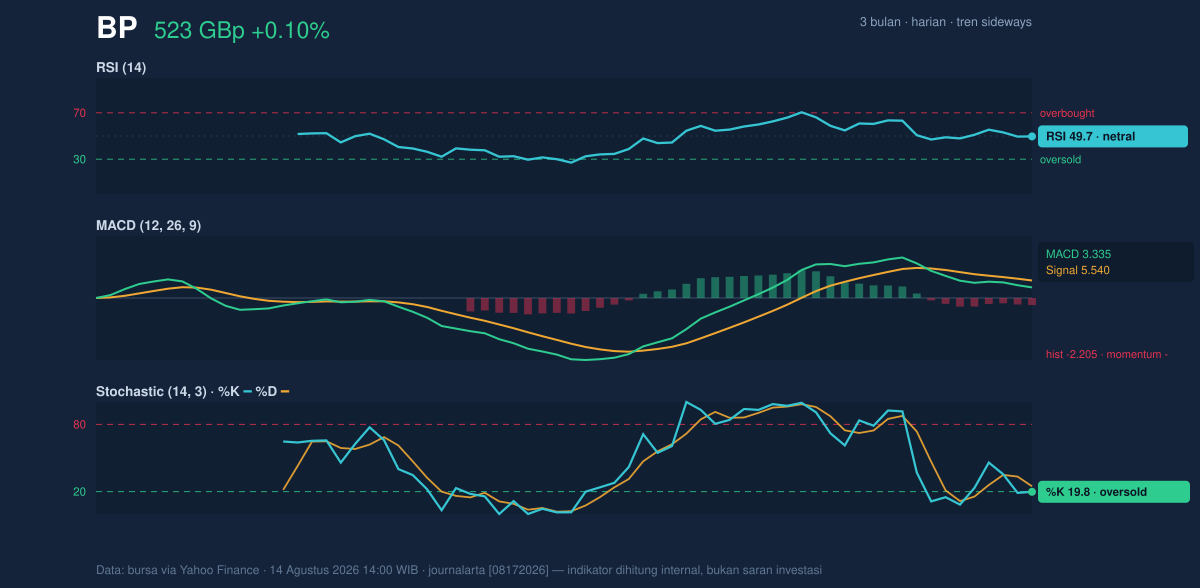
The RSI at 49.7 is essentially neutral. That is an important signal because it says BP is neither overbought nor oversold on this measure; the market is balanced rather than stretched. But the stochastic oscillator is more revealing: %K at 19.8 and %D at 24.7 place the stock in oversold territory, which often means downside pressure has been intense enough to leave the shares vulnerable to a rebound. Oversold does not guarantee a rise; it simply tells readers that the recent selloff may be getting tired.
The MACD is still weaker. With MACD at 3.335, the signal line at 5.540, and a -2.205 histogram, momentum remains negative because the MACD line is below its signal line. In practical terms, that means the recent move has not yet regained enough force to confirm a sustained upswing. So while stochastic hints at a short-term bounce, MACD says the broader momentum has not turned.
This is the key tension in BP right now: the oscillators are not aligned. One is hinting at exhaustion in the downside, while another still shows negative momentum. That kind of mix often leads to choppy trading rather than a clean trend.
Volatility & Volume
Volatility is present, but not extreme. The ATR at 15.19, equal to 2.9% of price, points to moderate daily movement. That means BP can still swing enough to test nearby levels, but the market is not in a panic phase. Bollinger Bands reinforce that view: the band width is 9.3%, described as normal, which suggests no volatility squeeze is building into a dramatic breakout setup. Price is also at %B 30%, meaning it is trading closer to the lower band than the middle. That is consistent with a weak or cautious tone, but not necessarily with a breakdown already in motion.
Volume is the clearest sign that traders are engaged. The latest turnover of 110,177,446 is about 2.1× the 20-hour average of 51,310,140. A jump like that usually means the market is paying attention, even if the direction is not decisive. However, OBV is down, and that matters because On-Balance Volume tracks whether volume is accompanying price gains or losses. A falling OBV tells us that, despite the surge in activity, the heavier flow has still favored distribution rather than accumulation.
Key Levels & Scenarios
The nearest line in the sand is 514.90. If BP holds above that support, the stock can continue to base and attempt a move back toward 532.96, the SMA20, where the market would first need to prove that the short-term drift is improving. Above that, 555.90 is the next meaningful resistance, and a move through it would show that buyers have finally absorbed the recent selling pressure.
If BP fails to hold 514.90, the picture weakens quickly because that would put the shares back toward the lower part of the recent range and raise the risk of a deeper test of the broader support zone near the 3-month low of 450.60. For now, the chart sits in a middle ground: not strong enough to call a breakout, but not broken enough to dismiss.
Technical Verdict: HOLD (wait & see)
HOLD (wait & see)
- Reason 1: Price is below the SMA20 at 532.96, which keeps the short-term trend subdued.
- Reason 2: RSI at 49.7 is neutral, while stochastic at 19.8/24.7 is oversold, creating a mixed signal rather than a confirmed reversal.
- Reason 3: MACD 3.335 below signal 5.540 with a -2.205 histogram still points to negative momentum, even though volume is elevated.
- Verdict invalidated if price breaks below 514.90, because that would weaken the current base and shift attention toward the lower range.
- Ideal Entry Range: 514.90 to 532.96
- Exit Target (Target Price): 555.90
- Stop Loss protection: below 508.20
In plain English: BP is not yet showing enough technical strength to confirm a fresh upward move, but it also has not lost its footing.
Summary Data BP
| Last price | 522.90 GBp |
| Change 1 day / 5 days / 1 month | 0.10% / 1.10% / 1.12% |
| Trend / MA-cross | sideways / none |
| SMA20 / SMA50 | 532.96 / 511.90 |
| RSI (14) / Stochastic %K | 49.7 / 19.8 |
| Bollinger %B / ATR | 30% / 15.19 |
| Support / Resistance 20 days | 514.90 / 555.90 |
| Data as of | 14 Agustus 2026 14:00 WIB |


