AstraZeneca Stock Analysis: Drops 2.12%, Testing Support Level
On Agustus 17, 2026: price 11,460.00 GBp, trend downtrend, RSI 32.9, support 11,460.00, resistance 13,134.00. technical analysis of astrazeneca stock.

AstraZeneca’s London-listed shares fell to 11,460.00 GBp by 14 August 2026 at 14:00 WIB, according to exchange data via Yahoo Finance, leaving the stock at the very bottom of its recent trading range and below both its short- and medium-term moving averages. That matters because the price is not just drifting lower; it is doing so while the trend structure remains pointed down, with the 20-day moving average still falling and the shares sitting under a key reference line that often acts as a first test of whether sellers remain in control.
Trend & Price Action
The chart shows a market still leaning negative. AZN.L is below its SMA20 at 12,248.60 and well under its SMA50 at 13,026.64, which tells traders that recent weakness is not an isolated dip but part of a broader loss of upward momentum. The absence of a fresh moving-average cross also matters: it means there is no new technical trigger suggesting the down move has been reversed.
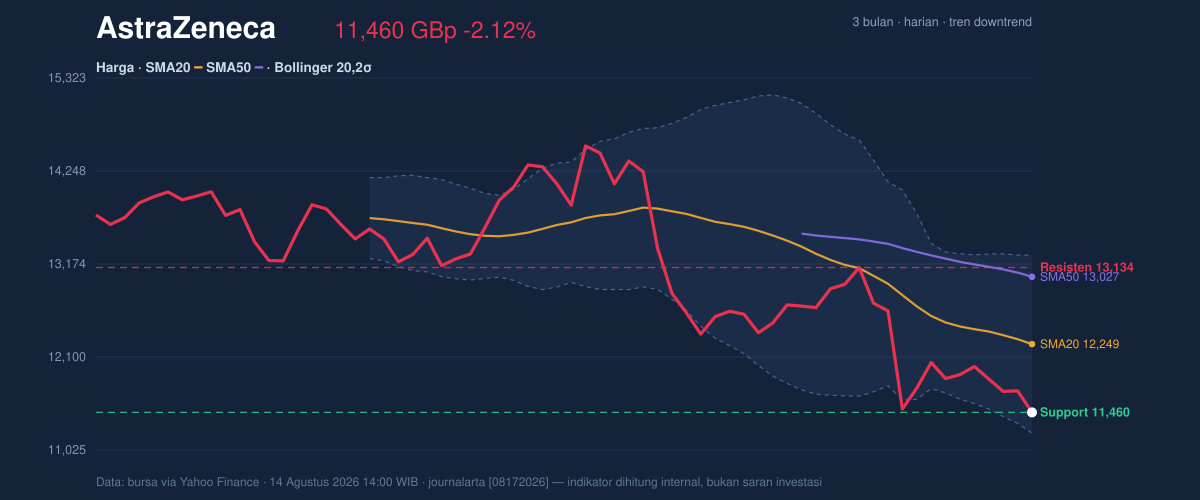
The stock’s position inside the 20-hour range is even more telling. With support at 11,460.00 and resistance at 13,134.00, the latest print sits at 0% of the range, effectively at the floor. In plain language, that means the market is testing whether buyers will defend the lowest area they have recently managed to hold. The broader three-month range, from 9,892.00 to 15,126.00, shows there is still room below if this floor gives way, but also that the shares are already close to the lower end of a wider band.
The Bollinger setup reinforces that pressure. %B at 12% means the price is trading very close to the lower band, not near the middle or upper part of its recent volatility envelope. That usually signals a stretched downside move, but not necessarily an immediate rebound. The band width of 16.8% is described as normal, so this is not a volatility breakout yet; it is more a controlled slide than a panic move.
Oscillators & Momentum
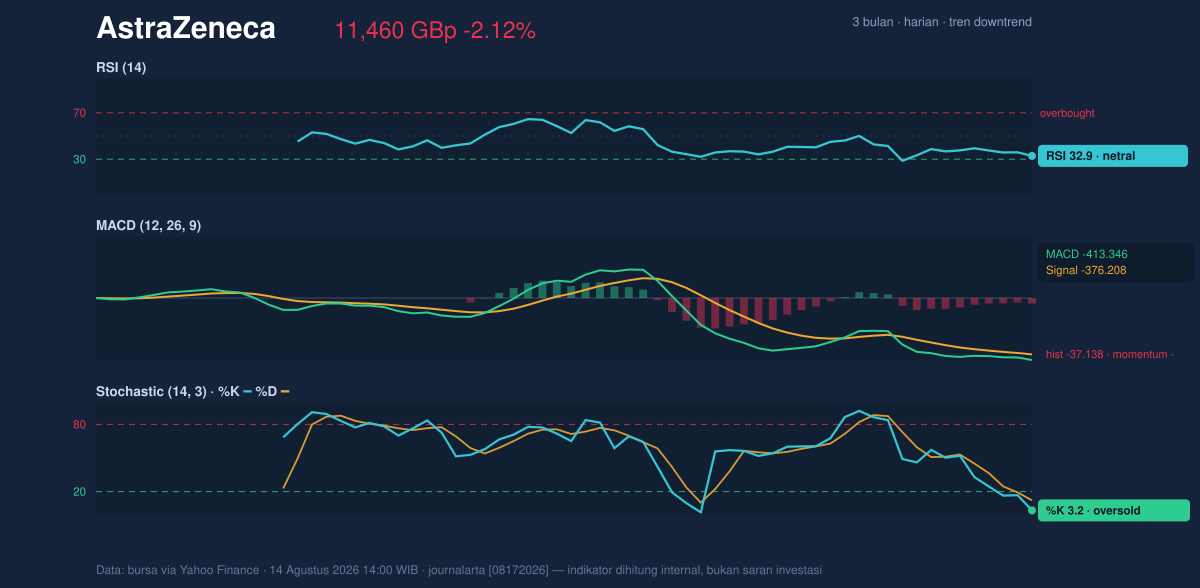
Momentum indicators are mixed, and that mix is important. RSI at 32.9 is neutral by the supplied classification, but it is close to the oversold zone, which suggests the selloff is getting mature without yet proving a reversal. By contrast, the Stochastic %K at 3.2 and %D at 12.1 are clearly oversold. That usually means the stock is trading near the lower end of its recent range and may be vulnerable to a technical bounce, but oversold conditions can persist in a strong downtrend.
The MACD confirms that the trend remains under pressure. MACD at -413.346 is below its signal line at -376.208, and the histogram at -37.138 shows the gap is still negative. In simple terms, that means downside momentum is still active, even if it is no longer accelerating sharply. For a recovery signal, traders would want to see the histogram narrow and the MACD line start moving back toward the signal line; that is not happening yet.
Volatility & Volume
Volatility is present but not extreme. ATR(14) at 390.80, equal to 3.4% of price, suggests the shares can still move meaningfully in a day, but the market is not in a disorderly state. That makes nearby levels more important, because a move through support or resistance can happen without needing an outsized catalyst.
Volume does not show a dramatic capitulation or a clear exhaustion signal. Last trade volume of 4,272,813 was close to the 20-hour average of 4,375,167, or 1.0x normal. That tells us the decline is being accepted rather than violently rejected. Yet the OBV is rising, which is the one constructive clue in the tape. OBV, or on-balance volume, tracks whether trading volume is flowing more into up days or down days; a rising reading can imply underlying accumulation even while price is weak. In other words, some buyers may be stepping in quietly, but they have not yet forced the chart to turn.
Key Levels & Scenarios
The immediate technical picture is straightforward. 11,460.00 GBp is the level to watch on the downside because it is both the latest price and the current support marker. A hold here would preserve the possibility of a reflex bounce toward the middle Bollinger band at 12,248.60, then perhaps toward the nearer resistance at 13,134.00. If the share price cannot hold 11,460.00, the next area of interest is the lower edge of the wider three-month range at 9,892.00.
The upside is still conditional. A move back above 12,248.60 would be the first sign that the stock is reclaiming its short-term trend line, while a push through 13,134.00 would matter more because it would show the market has recovered enough to challenge the recent ceiling. Until then, the chart remains a test of whether oversold momentum can translate into actual price repair.
Technical Verdict: HOLD (wait & see)
HOLD (wait & see)
- RSI at 32.9 and Stochastic at 3.2/12.1 show the stock is stretched to the downside, but not yet in a confirmed reversal.
- MACD remains negative and below its signal line, which means the downtrend is still active.
- Price below SMA20 and SMA50 keeps the broader technical structure bearish, even though OBV is rising.
Verdict invalidated if price breaks below 11,460.00 and fails to reclaim it.
- Ideal Entry Range: 11,460.00 to 12,248.60
- Exit Target: 13,134.00
- Stop Loss protection: below 11,220.62
In plain English: the chart is weak, but it is weak in a way that could still produce a bounce if the current floor holds.
Summary Data AstraZeneca
| Last price | 11,460.00 GBp |
| Change 1 day / 5 days / 1 month | -2.12% / -3.67% / -9.00% |
| Trend / MA-cross | downtrend / none |
| SMA20 / SMA50 | 12,248.60 / 13,026.64 |
| RSI (14) / Stochastic %K | 32.9 / 3.2 |
| Bollinger %B / ATR | 12% / 390.80 |
| Support / Resistance 20 days | 11,460.00 / 13,134.00 |
| Data as of | 14 Agustus 2026 14:00 WIB |


