Shell Stock Gains 0.97%, Momentum Weakens In Focus
On Agustus 17, 2026: price 3,320.00 GBp, trend uptrend, RSI 56.2, support 3,220.00, resistance 3,405.50. technical analysis of shell stock.

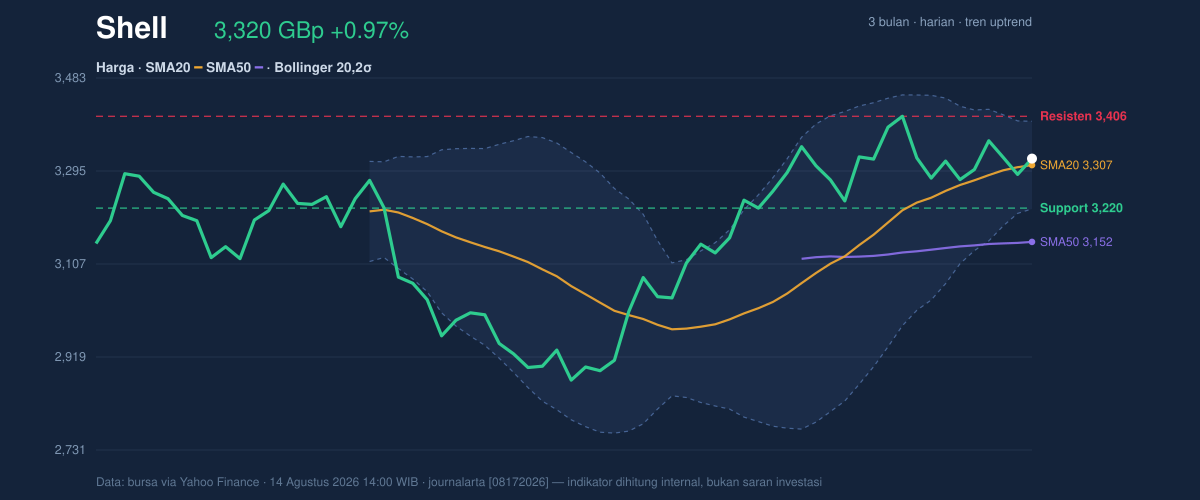
Shell plc traded at 3,320.00 GBp on the LSE on 14 August 2026, edging above the previous close of 3,288.00 as the shares held a modest gain in a market that is still trying to decide whether the recent rebound has real follow-through or is just a pause inside a broader recovery. The stock is now sitting above its SMA20 at 3,306.88 and well above its SMA50 at 3,151.62, which keeps the medium-term trend pointed higher, but the tape is not fully clean: momentum gauges are mixed, volume is heavier than average, and the price is pressing into a narrow band that often precedes a sharper move.
Trend & Price Action
The first signal is straightforward: Shell remains in an uptrend, and the slope of the SMA20 at 1.23% over 5 days says the short-term base is still rising rather than flattening out. That matters because moving averages are not just lines on a chart; they are a shorthand for whether buyers are willing to keep paying up after each pullback. With the shares trading above the SMA20 and comfortably above the SMA50, the structure still favours accumulation over distribution.
The price is also positioned in the middle of its recent Bollinger range, with the stock at about 54% of the 20-day range. That is not an overheated position, but it is close enough to the upper half to suggest the market has already priced in some near-term optimism. As shown in the chart, the key issue is that the shares are approaching resistance at 3,405.50 while the nearest support sits at 3,220.00, which is also the lower edge of the current trading range. That makes this a market where direction will likely be decided by whether Shell can escape the current band or slips back into it.
Oscillators & Momentum
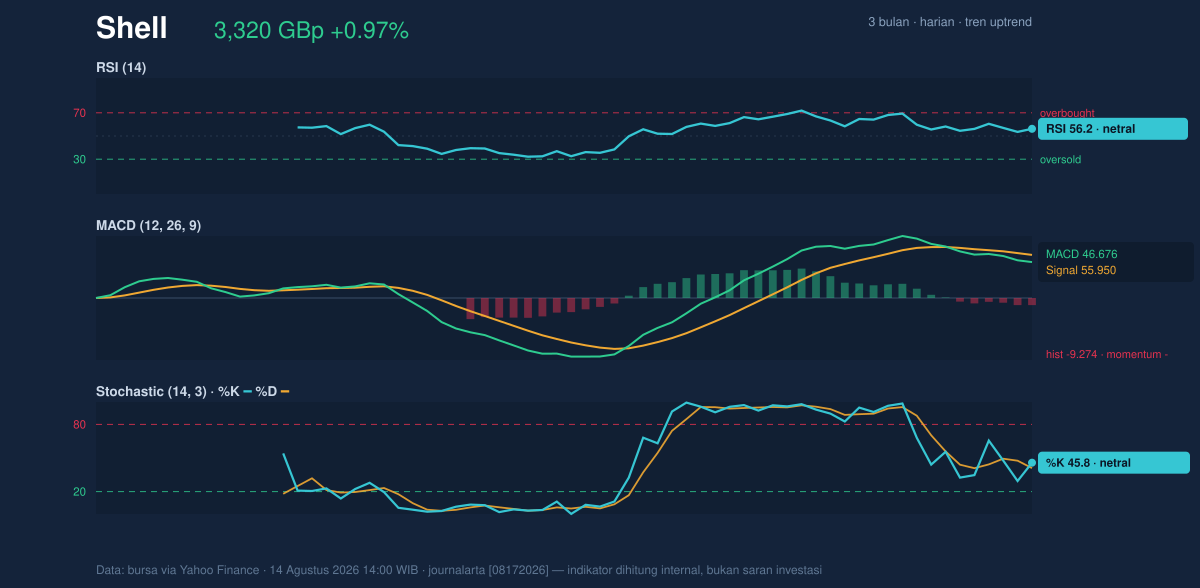
The momentum picture is more restrained than the trend picture. RSI at 56.2 is neutral, which means the stock is neither stretched nor washed out; it is simply in a zone where the market still has room to move either way. The Stochastic %K at 45.8 and %D at 41.0 also read as neutral, reinforcing the idea that Shell is not yet showing the kind of overbought condition that often precedes a short-term pullback, but neither is it flashing a strong upside acceleration signal.
The more cautionary note comes from MACD at 46.676 versus the signal line at 55.950, with a negative histogram of -9.274. In plain English, that means the recent price trend is still positive, but the pace of that trend has cooled and the shorter-term average is running below the slower one. That is often a warning that buyers are losing urgency even while the chart still looks constructive on the surface. As shown in the momentum chart, this is not a collapse signal; it is a divergence that asks for confirmation before the next leg higher can be trusted.
Volatility & Volume
Bollinger Bands are telling a useful story here. The upper band stands at 3,395.42, the middle band at 3,306.88, and the lower band at 3,218.33, while the band width is just 5.4%. That narrowness signals a squeeze, which usually means volatility has compressed and the stock may be storing energy for a break. Squeezes do not predict direction on their own, but they do tell traders that the current quiet may not last.
Volume adds a second layer. The latest turnover of 11,446,789 shares is about 1.3 times the 20-session average of 8,648,591, so there is real participation behind the move. That is important because a quiet drift higher is easier to dismiss; heavier volume suggests institutions and larger holders are engaged. The catch is that OBV is falling, which means the cumulative volume trend is not confirming the price rise. In simple terms, more shares are changing hands, but the balance of volume has not yet turned decisively in favour of buyers.
Shell’s ATR at 71.45, or 2.2% of price, says daily swings are moderate rather than explosive. That makes the current squeeze more interesting: volatility is contained now, but the chart is set up for a larger-than-usual move once the range gives way.
Key Levels & Scenarios
The immediate battlefield is clear. A sustained push through 3,395.42 to 3,405.50 would place the stock above both the upper Bollinger band and the nearest resistance, which would strengthen the case that the squeeze is resolving upward. If that fails, the price may simply rotate back toward 3,306.88, the middle band and SMA20, which is the first line that has been supporting the current advance.
The deeper support to watch is 3,220.00. A break below that level would matter because it would not just be a minor intraday wobble; it would also push the shares under the lower Bollinger band at 3,218.33, a sign that the squeeze has resolved against the bulls rather than for them. The 3-month range also frames the bigger picture: Shell is trading well above the 2,559.50 low, but still below the 3,758.50 high, so there is room on both sides and no long-term breakout has been completed yet.
Technical Verdict: HOLD (wait & see)
HOLD (wait & see) because the trend remains constructive, but momentum is not fully confirming the move.
- Reason 1: SMA20 and SMA50 are aligned above price structure, with the stock above 3,306.88 and 3,151.62, which preserves the uptrend.
- Reason 2: Bollinger Bands are squeezing, with width at 5.4%, so a directional move may be near but is not yet confirmed.
- Reason 3: MACD is negative, with the histogram at -9.274, and OBV is falling, so price strength is not fully backed by volume trend.
- Verdict invalidated if price breaks below 3,220.00, because that would violate the nearest support and the lower Bollinger band area.
- Ideal Entry Range: 3,220.00 to 3,306.88
- Exit Target (Target Price): 3,395.42 to 3,405.50
- Stop Loss protection: below 3,218.33 or, more conservatively, below 3,220.00
For non-traders, this means Shell’s chart is still leaning upward, but the next move needs confirmation before the market shows its hand.
“The squeeze is real, but so is the hesitation.”
Summary Data Shell
| Last price | 3,320.00 GBp |
| Change 1 day / 5 days / 1 month | 0.97% / 1.30% / 2.60% |
| Trend / MA-cross | uptrend / none |
| SMA20 / SMA50 | 3,306.88 / 3,151.62 |
| RSI (14) / Stochastic %K | 56.2 / 45.8 |
| Bollinger %B / ATR | 57% / 71.45 |
| Support / Resistance 20 days | 3,220.00 / 3,405.50 |
| Data as of | 14 Agustus 2026 14:00 WIB |


