HSBC Stock Gains 0.34%, Momentum Weakens In Focus
On Agustus 18, 2026: price 1,531.00 GBp, trend sideways, RSI 52.9, support 1,480.80, resistance 1,597.40. technical analysis of hsbc stock.

HSBC Holdings shares rose to 1,531.00 GBp in London on 14 August 2026 at 14:00 WIB, up 0.34% on the day, but the bigger message from the chart is that the stock is still trading below its 20-day average of 1,540.32 even after a modest one-month gain of 2.60%. That combination matters: the price is not weak enough to be breaking down, yet it has not reclaimed short-term trend control either. As shown in the chart, HSBC is sitting in the middle of a sideways range, with buyers and sellers still negotiating around the same band rather than committing to a clear direction.
Trend & Price Action
The structure is best described as sideways, and the slope of the SMA20 is still positive at 0.73% over 5 days, which tells us the short-term drift is improving even though the share price remains below the SMA20. That is an important distinction: a rising average often signals that the recent path of least resistance is turning higher, but until price moves back above that line, the trend has not fully confirmed. The longer average is more supportive, with SMA50 at 1,473.72 sitting below the market, so the medium-term base remains intact. There has been no fresh MA-cross, which means the chart is not flashing a clean trend reversal signal; instead, it is showing a holding pattern after a period of recovery.
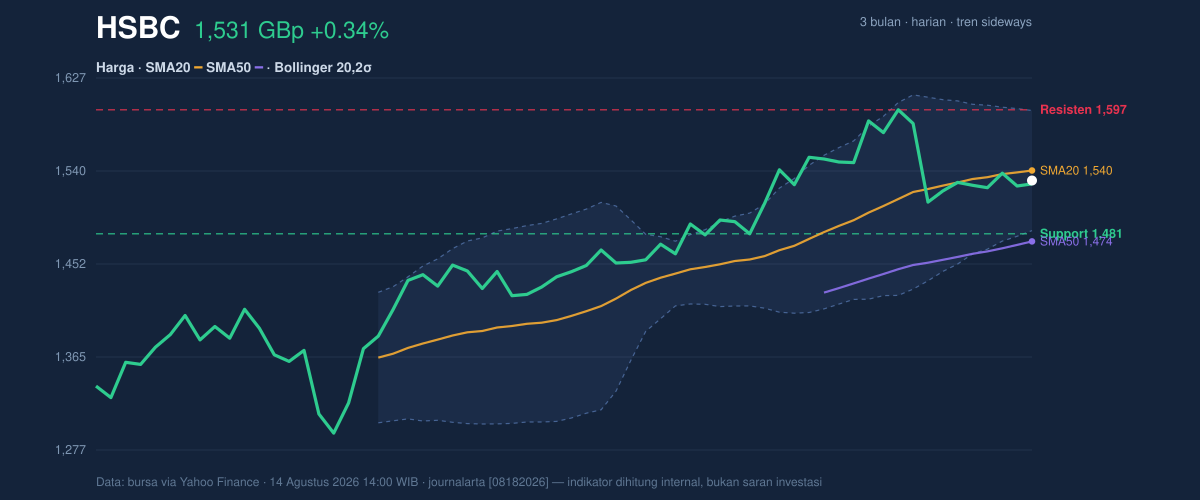
Positioning inside the range is also telling. HSBC is trading at about 43% of the 20-day range, between support at 1,480.80 and resistance at 1,597.40. That places the stock closer to the lower half of the band than the top, but not at a stressed low. The shares are also below the upper Bollinger band at 1,596.79 and above the lower band at 1,483.85, which reinforces the idea of compression rather than trend acceleration. In plain terms, the market is coiling, not trending hard.
That kind of setup usually rewards patience more than urgency.
Oscillators & Momentum
The momentum signals are mixed, but not broken. RSI at 52.9 is neutral, which means the stock is neither overbought nor oversold and has room to move either way without immediately hitting an exhaustion reading. The Stochastic %K at 39.2 and %D at 41.2 also sits in neutral territory, slightly below the midpoint, suggesting short-term momentum is still subdued rather than forcefully bullish. As shown in the chart, these oscillators are not confirming a breakout attempt yet, but they are also not showing the kind of stretched conditions that often precede a sharp reversal.
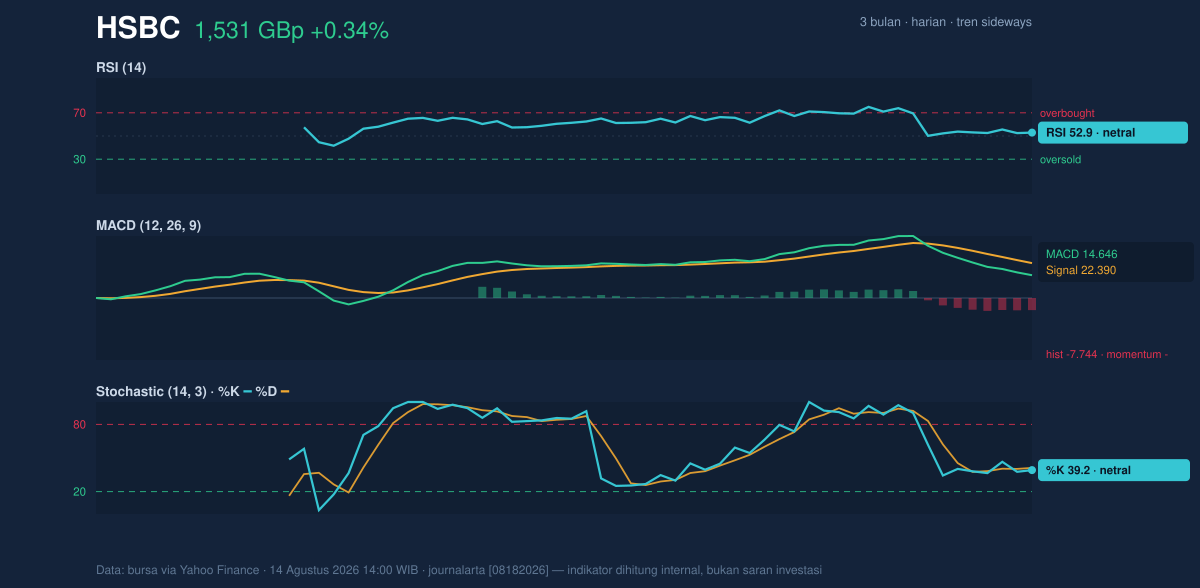
The more cautionary signal comes from MACD at 14.646 versus signal at 22.390, leaving a -7.744 histogram. For general readers, MACD tracks whether recent price movement is gaining or losing steam; when it sits below its signal line, momentum is fading. Here, that negative spread says the recent bounce has not yet converted into strong follow-through. So while the broader trend is not damaged, the immediate impulse is still softer than price alone might suggest.
Volatility & Volume
Volatility is present, but not extreme. ATR(14) at 35.13, or 2.3% of price, points to a market that can move meaningfully without becoming disorderly. That matters because a squeeze in the Bollinger Bands often precedes a larger move: the band width is only 7.3%, described here as narrowing, which implies the market has been compressing and may be preparing for a breakout in either direction. The %B reading of 42% shows price is below the middle of the band, so the stock has not yet regained the upper half of its short-term volatility envelope.
Volume gives the setup more credibility. The latest turnover of 42,408,141 is about 1.5× the 20-day average of 28,934,607, and OBV is rising. OBV, or on-balance volume, tracks whether volume is flowing into or out of the stock; a rising line suggests accumulation is edging ahead of distribution. That is constructive because it indicates real participation behind the recent move, even if price has not yet broken decisively above resistance. In other words, the market is showing interest before showing conviction.
Key Levels & Scenarios
The first level to watch is support at 1,480.80. If that floor holds, HSBC can continue to base out inside the current range and potentially retest the upper band near 1,596.79 to 1,597.40. A move through that resistance zone would matter because it would place price back above the SMA20 at 1,540.32 and into the top of the Bollinger range, giving the chart a better chance of shifting from neutral to constructive.
If the shares fail to hold 1,480.80, the chart would lose the lower edge of the current consolidation and expose the market to a deeper retracement toward the lower part of the 3-month range, with the recent 3-month low at 1,267.20 standing as the broader reference point. The stock is still far above that low, but the message of a break below support would be that the squeeze has resolved in favor of sellers rather than buyers.
Technical Verdict: HOLD (wait & see)
HOLD (wait & see) is the clearest technical reading because the chart is balanced: price is below the SMA20, MACD momentum is negative, but OBV is rising and the Bollinger Band squeeze suggests a move is building rather than fading. The stock is not in a confirmed downtrend, yet it has not reclaimed enough short-term strength to justify calling the setup bullish. The most important invalidation is straightforward: this view is invalidated if price breaks below 1,480.80.
- Ideal Entry Range: 1,483.85 to 1,540.32, using the lower Bollinger band and SMA20 as the main technical zone
- Exit Target: 1,596.79 to 1,597.40, aligned with the upper Bollinger band and 20-day resistance
- Stop Loss protection: below 1,480.80, the 20-day support floor
For non-traders, this means HSBC is still stuck in a tight range, with signs of accumulation but no clear breakout yet.
3-month high: 1,610.00
Summary Data HSBC
| Last price | 1,531.00 GBp |
| Change 1 day / 5 days / 1 month | 0.34% / 0.12% / 2.60% |
| Trend / MA-cross | sideways / none |
| SMA20 / SMA50 | 1,540.32 / 1,473.72 |
| RSI (14) / Stochastic %K | 52.9 / 39.2 |
| Bollinger %B / ATR | 42% / 35.13 |
| Support / Resistance 20 days | 1,480.80 / 1,597.40 |
| Data as of | 14 Agustus 2026 14:00 WIB |

