BP Testing Support Level: Stock Drops 0.54% (Agustus 18, 2026)
On Agustus 18, 2026: price 519.60 GBp, trend sideways, RSI 49.4, support 514.90, resistance 555.90. technical analysis of bp stock. BP Testing Support Level —…

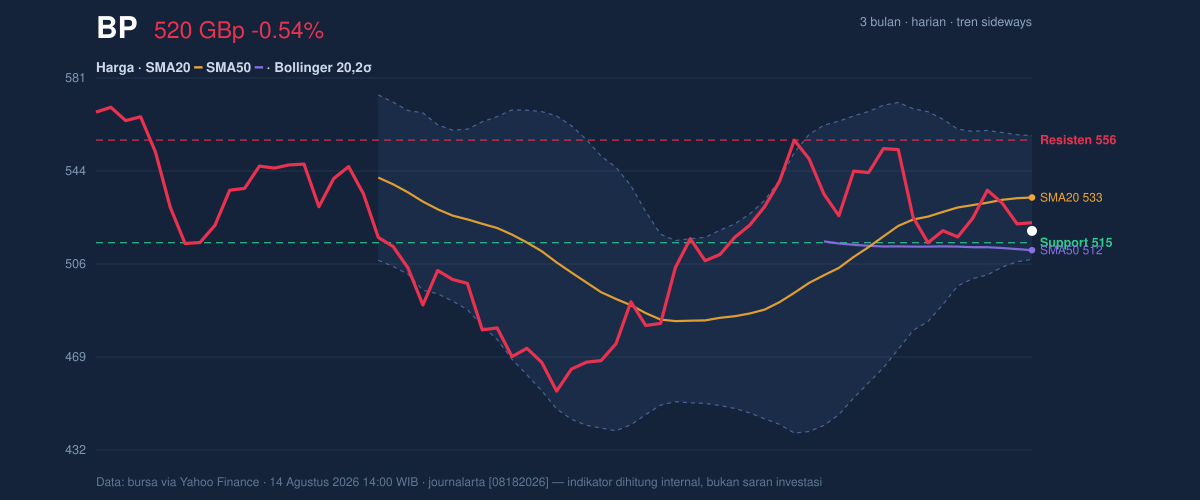
BP plc is trading in a narrow, undecided band, and that matters because the shares are sitting between a short-term recovery zone and a heavier layer of overhead resistance. At 519.60 GBp, the stock is below its 20-day average but still above its 50-day average, a setup that points to consolidation rather than a clean trend.
Trend & Price Action
The latest print leaves BP below SMA20 at 532.96 but above SMA50 at 511.90, which is often read as a market that has not fully broken down, yet has not regained short-term control either. The 20-day average is still rising at 0.76% over five days, so the broader short-term drift has not turned decisively negative. Instead, the chart shows a sideways structure, with price sitting in the middle of a wider 3-month range between 575.70 and 450.60.
That placement matters. BP is not testing the lower edge of the range, but it is also not pressing the upper boundary. The stock is trading only 11% into the 20-hour range, with 514.90 acting as immediate support and 555.90 as the first notable resistance. As shown in the chart, the shares are hovering close to the lower half of the recent band, which suggests the market is waiting for a clearer catalyst rather than pricing one in already.
Oscillators & Momentum
The momentum picture is mixed, and that is the key signal here. RSI at 49.4 is essentially neutral, meaning BP is neither stretched nor washed out on the standard 14-day measure. That neutral reading usually reinforces the idea of a range-bound market.
The more interesting detail is in the stochastic oscillator. %K at 19.8 and %D at 24.7 put the stock in oversold territory, which can indicate near-term exhaustion after weakness. But oversold does not automatically mean reversal; it only says downside momentum has become compressed enough that a bounce can develop if buyers return.
That caution is reinforced by MACD. MACD at 3.150 sits below its signal line at 5.269, with a -2.119 histogram. In plain language, the trend-following momentum gauge is still negative, so the stock has not yet proved that the recent weakness is over. This is why the technical picture remains mixed: stochastic hints at a short-term rebound, while MACD says the broader momentum still leans down.

Volatility & Volume
Volatility is present, but not extreme. ATR at 15.19, equal to 2.9% of price, indicates moderate daily movement. That means BP can still travel meaningfully in a session, but the tape is not showing panic-style swings. The Bollinger Bands also support that reading: the band width is 9.3%, described as normal, not squeezed tightly and not expanding aggressively.
The price location inside those bands is more telling. With %B at 23%, BP is trading near the lower part of the Bollinger structure, close to the 508.20 lower band and well below the 532.96 midline. That usually signals that the stock is priced with some caution, but it is not yet at an extreme that would force a reversal call on its own.
Volume, however, adds a different layer. Last turnover was 110,177,446, around 2.1 times the 20-day average of 51,310,140. Heavy volume during a weak or flat phase can mean two very different things: either stronger participation in a move, or distribution if the stock fails to rise despite the surge in activity. The fact that OBV is falling leans toward the second interpretation. On-balance volume tracks whether trading volume is accumulating on up days or draining away on down days; a decline here suggests sellers have had the upper hand in recent sessions, even with the latest volume spike.
Key Levels & Scenarios
The immediate map is clear. 514.90 is the first support to watch, and it sits just below the current price, so it is the level most likely to be tested first if weakness continues. A clean hold there would keep the stock inside its recent range and could allow a bounce toward the 532.96 SMA20, then the 555.90 resistance zone.
If BP fails to hold 514.90, the next reference is the 508.20 Bollinger lower band, which often acts like a pressure point when short-term selling persists. A move below that area would suggest the market is no longer simply drifting sideways and may be starting to lean toward the lower half of the 3-month range.
On the upside, 555.90 is the first barrier that matters because it sits above both the recent trading band and the 20-day average. A move through that area would be more meaningful if it is accompanied by improving MACD and a lift in RSI, because that would show the bounce is becoming broader participation rather than just a short-covering pop.
Technical Verdict: HOLD (wait & see)
HOLD (wait & see)
- MACD remains negative, with the line below signal and a -2.119 histogram, so trend momentum has not confirmed a recovery.
- Stochastic is oversold at %K 19.8 / %D 24.7, which supports the possibility of a bounce, but not yet a full trend reversal.
- Price is below SMA20 at 532.96 but above SMA50 at 511.90, leaving the stock in a neutral-to-soft range rather than a clear bullish or bearish trend.
Verdict invalidated if price breaks below 508.20, because that would mean the lower Bollinger band and nearby support have failed together.
- Ideal entry range: 514.90 to 508.20
- Exit target: 532.96 to 555.90
- Stop loss protection: below 508.20
In plain English: BP is neither showing a clean recovery nor a decisive breakdown, so the chart is asking for patience rather than commitment.
The next technical checkpoint is whether the shares can reclaim 532.96 while holding 514.90, with the latest volume surge and falling OBV now pulling in opposite directions.
Summary Data BP
| Last price | 519.60 GBp |
| Change 1 day / 5 days / 1 month | -0.54% / 0.46% / 0.48% |
| Trend / MA-cross | sideways / none |
| SMA20 / SMA50 | 532.96 / 511.90 |
| RSI (14) / Stochastic %K | 49.4 / 19.8 |
| Bollinger %B / ATR | 23% / 15.19 |
| Support / Resistance 20 days | 514.90 / 555.90 |
| Data as of | 14 Agustus 2026 14:00 WIB |


