AstraZeneca Stock Drops 1.26%, Testing Support Level In Focus
On Agustus 18, 2026: price 11,560.00 GBp, trend downtrend, RSI 32.9, support 11,460.00, resistance 13,134.00. technical analysis of astrazeneca stock.

According to data from the London Stock Exchange via Yahoo Finance, AstraZeneca’s shares closed at 11,560.00 GBp on 14 August 2026, extending a slide that has left the stock below its 20-day average of 12,248.60 and well under its 50-day average of 13,026.64. That matters because prices trading beneath both short- and medium-term trend lines usually signal that sellers still control the tape, even if the pace of decline is not accelerating sharply. The latest move was -1.26% on the day, after -2.82% over five days and -8.21% over one month, a pattern that points to persistent pressure rather than a one-day wobble.
Trend & Price Action
The chart shows a stock that is still leaning lower, with the SMA20 sloping down by -1.63% over five days. That slope is important: it tells readers the short-term trend is not merely below average, but that the average itself is falling, a sign the market has yet to find a stable base. There is no fresh MA-cross, so there is no technical evidence yet of a trend reversal from the moving averages alone. In plain language, the stock has not done enough to prove that buyers have regained control.
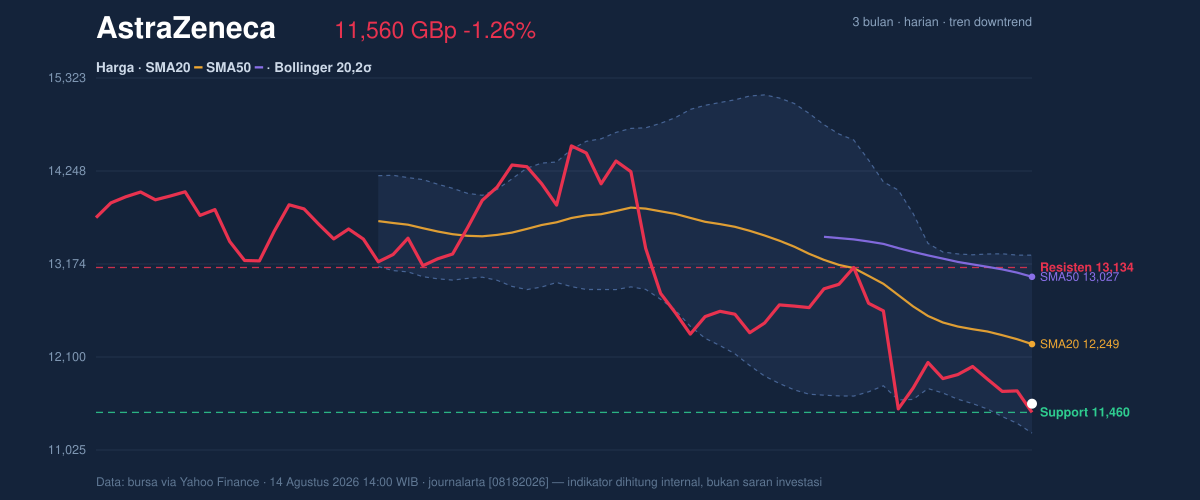
Price is also sitting near the lower part of its recent trading band. At 11,560.00 GBp, AstraZeneca is only about 6% of the way up the 20-hour range between support at 11,460.00 and resistance at 13,134.00. That positioning matters because it shows the market is closer to the floor than the ceiling, but not yet far enough above support to call it a clean rebound. The broader three-month range — 15,126.00 to 9,892.00 — frames the current move as a retracement inside a wider swing, not a collapse into new territory.
Oscillators & Momentum
The momentum picture is mixed, and that mix is the main reason this name does not look ready for a trend change. The RSI at 32.9 is still classed as neutral, but it is close to the oversold zone, which means the shares are weak without yet being washed out. More telling is the Stochastic reading of %K 3.2 and %D 12.1, which is oversold. Stochastic measures where price sits within its recent range; at these levels, it suggests the stock is stretched on the downside and could bounce, but only if price starts to stabilise.
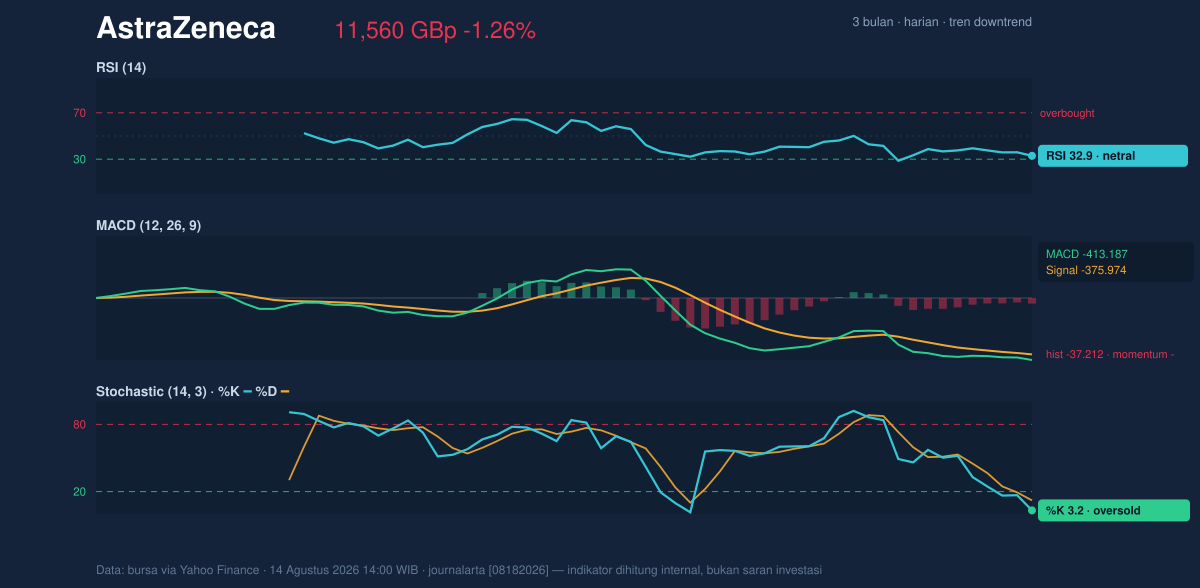
The MACD is negative at -413.187, below its signal line at -375.974, with a histogram of -37.212. That combination means downward momentum is still dominant, and the gap between MACD and signal line shows the trend has not yet turned. Put simply, the oscillators are not agreeing with the broader downtrend in the same way: Stochastic says the stock is stretched, while MACD says the fall is still alive. That divergence often appears near a pause or bounce, but it is not the same as confirmation.
Volatility & Volume
Volatility is moderate, not extreme. The ATR(14) of 390.80, equal to 3.4% of price, suggests the shares can still move enough in a session to matter, but not in a disorderly way. Bollinger Bands add another layer to that picture. With %B at 17%, price is sitting close to the lower band, which usually indicates the stock is trading near the bottom of its recent statistical envelope. The Bollinger band width of 16.8% is described as normal, so there is no obvious squeeze building for a dramatic breakout. Instead, the setup implies a market that is depressed but not yet compressed enough to promise a sharp move.
Volume does not yet show a strong conviction shift. The latest volume of 4,272,813 is close to the 20-hour average of 4,375,167, or about 1.0× normal. That means the sell-off is not being accompanied by a dramatic surge in turnover, which can sometimes indicate forced liquidation or panic. At the same time, OBV is rising, and that is the more constructive clue. On-balance volume rising while price is weak can mean accumulation is quietly happening beneath the surface, even if it has not yet shown up in the headline price trend.
Key Levels & Scenarios
The chart’s nearest support at 11,460.00 is now the level to watch most closely. If that floor holds, the stock has a chance to attempt a reflex move back toward the 20-day average at 12,248.60, where the first meaningful test would sit. Above that, 13,134.00 resistance marks the next barrier; a move through that area would suggest the recent downtrend is losing force. If support fails, the price would be vulnerable to a deeper revisit of the lower part of the three-month range, with the prior 9,892.00 low acting as the broader downside reference.
What the signals mean together is more nuanced than a simple bearish label. The stock is still in a downtrend, the MACD remains negative, and price is below the SMA20 and SMA50. But the oversold Stochastic, the low %B, and the rising OBV all hint that selling may be tiring. That is not a reversal signal on its own. It is a warning that the downside may be closer to a pause than to an acceleration, provided support continues to hold.
Technical Verdict: HOLD (wait & see)
HOLD (wait & see) is the clearest reading from the indicators. The stock is still under pressure, but it is also near support and showing oversold conditions that can precede a bounce.
- Reason 1: Price is below SMA20 and SMA50, and the SMA20 is still sloping lower, so the trend remains weak.
- Reason 2: MACD is negative and below signal, confirming that downside momentum has not fully faded.
- Reason 3: Stochastic is oversold and %B is only 17%, which suggests the shares are stretched near the lower band and may be due a stabilisation attempt.
- Verdict invalidated if price breaks below 11,460.00, as that would weaken the nearest support and increase the risk of a deeper leg lower.
- Ideal Entry Range: 11,460.00 to 11,560.00 GBp, close to support and the current price zone.
- Exit Target: 12,248.60 GBp, the SMA20 / Bollinger mid-band area.
- Stop Loss Protection: below 11,220.62 GBp, the lower Bollinger band.
Summary Data AstraZeneca
| Last price | 11,560.00 GBp |
| Change 1 day / 5 days / 1 month | -1.26% / -2.82% / -8.21% |
| Trend / MA-cross | downtrend / none |
| SMA20 / SMA50 | 12,248.60 / 13,026.64 |
| RSI (14) / Stochastic %K | 32.9 / 3.2 |
| Bollinger %B / ATR | 17% / 390.80 |
| Support / Resistance 20 days | 11,460.00 / 13,134.00 |
| Data as of | 14 Agustus 2026 14:00 WIB |

