Alibaba Stock Gains 1.64%, Momentum Weakens In Focus
On Agustus 20, 2026: price 124.20 HKD, trend uptrend, RSI 61.5, support 110.00, resistance 128.10. technical analysis of alibaba stock.

Alibaba Group’s Hong Kong-listed shares rose to HKD 124.20 on the HKEX by 18 August 2026, extending a broader uptrend even as short-term momentum has started to fray, according to data from Yahoo Finance via the exchange. The stock is still trading above its SMA20 at HKD 119.88 and well above the SMA50 at HKD 111.37, which tells the market that the medium-term structure remains constructive. But the latest move is not a clean breakout: the share price sits below the Bollinger upper band at HKD 132.00, with volatility now expanding, and that often means the next move can be sharper in either direction.
Alibaba is still moving higher, but the tape is becoming less forgiving.
Trend & Price Action
As shown in the chart, Alibaba’s price is holding in the upper half of its recent range, at HKD 124.20, or roughly 78% of the way from the 20-hour support at HKD 110.00 to the 20-hour resistance at HKD 128.10. That positioning matters because it shows buyers have kept control of the trend, but they have not yet forced a decisive break through resistance. The stock is also sitting inside a broader 3-month corridor between HKD 88.65 and HKD 135.50, leaving room for continuation if momentum improves, but not enough room to ignore nearby overhead supply.
The trend signal is supported by the SMA20 slope of 1.55% over 5 days, which indicates the short-term trend is still rising rather than flattening out. Price above both moving averages usually signals that recent buying has been strong enough to keep pullbacks contained. The absence of a new MA-cross means there has been no fresh moving-average breakout to reinforce the move, so the trend is positive but not freshly confirmed.
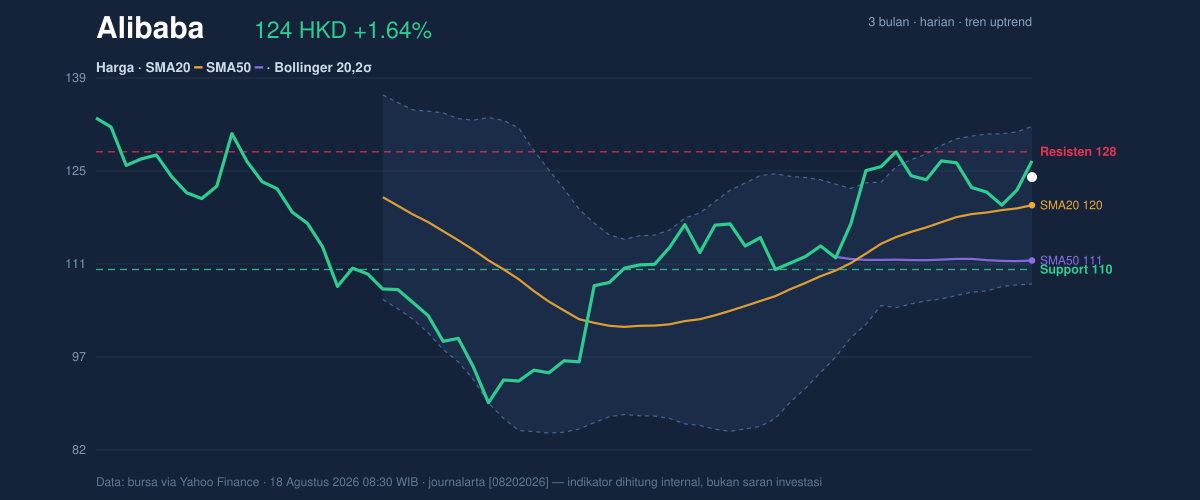
The message from price action is simple: buyers are still in charge, but they have not yet cleared the door.
Oscillators & Momentum
The momentum picture is more mixed, and that is where the chart becomes important. The RSI at 61.5 is still in neutral territory, which means the stock is not yet in an extreme overbought state. That is useful because it suggests the rally has not fully exhausted itself. However, the Stochastic %K at 82.0 versus %D at 63.2 is overbought, a sign that the latest push higher may be stretched in the short term. In plain terms, the stock has been climbing fast enough that it may need to pause before it can advance further.
The MACD at 3.399 remains above zero, which keeps the broader trend positive, but it is now below the signal line at 3.467 and the histogram is -0.068. That negative histogram is a subtle warning: the trend is still up, but the pace of upside momentum has slowed. When MACD slips under its signal line while price remains elevated, it often means the market is searching for a catalyst rather than accelerating.
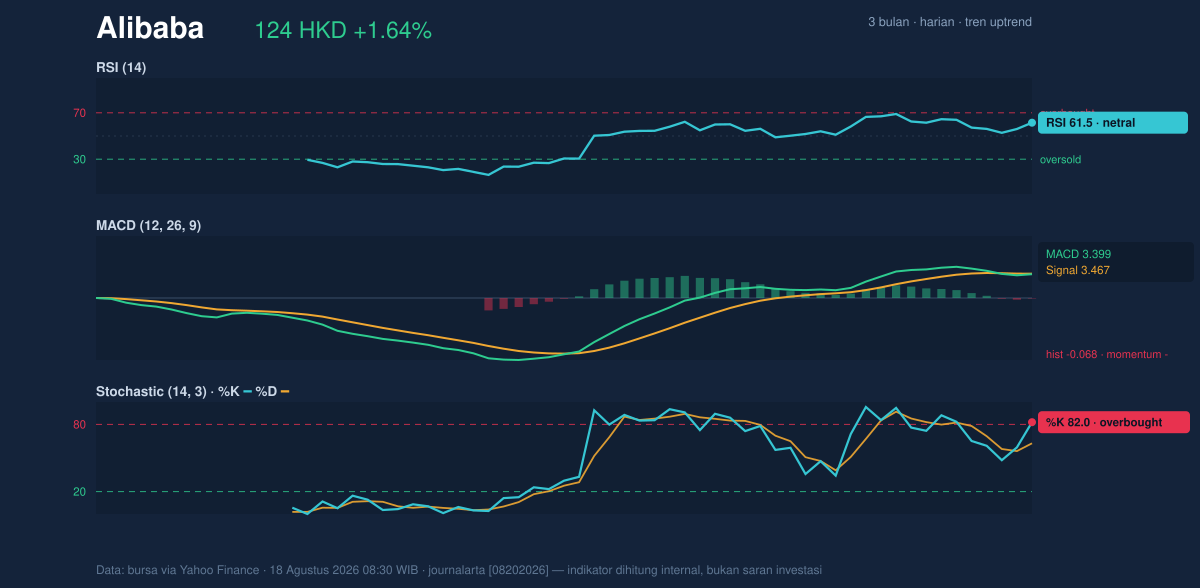
So the oscillator mix says: trend intact, momentum cooling.
Volatility & Volume
Volatility has picked up. The Bollinger Bands are wide, with the band width at 20.2% and the stock trading at %B 68%, meaning price is above the middle band but not pressing the upper edge. In practical terms, the market is no longer calm; it is priced for movement. The ATR(14) of 4.85, equal to 3.9% of price, reinforces that point. ATR measures the average daily range, so a higher reading means traders should expect wider swings around the trend.
Volume adds a second layer of caution. The latest turnover of 120,433,806 was about 1.4x normal versus the 20-hour average of 87,021,904, which confirms participation in the move. But the OBV is down, and that divergence matters. OBV, or on-balance volume, tracks whether volume is accumulating in a way that supports price. If price rises while OBV falls, it can mean the rally is being carried more by trading bursts than by steady accumulation. That is not a breakdown signal by itself, but it does suggest the advance is less solid than the headline price gain implies.
Volume is active, but not fully persuasive.
Key Levels & Scenarios
The first level to watch is HKD 128.10. A sustained move through that resistance would show buyers are finally absorbing supply near the top of the recent range. Above that, the next reference point is the Bollinger upper band at HKD 132.00, which often acts as a dynamic ceiling in trending markets. On the downside, HKD 119.88 is the immediate technical pivot because it is the SMA20 and the Bollinger middle band. A loss of that level would suggest the stock is losing short-term trend support and may revert toward HKD 110.00.
The 3-month high at HKD 135.50 remains the broader upside marker, but the current setup still needs proof before it can challenge that zone. Conversely, if the stock fails to hold HKD 119.88, the market would be signaling that the recent lift is fading into consolidation rather than extension.
Technical Verdict: HOLD (wait & see)
HOLD (wait & see)
- The trend is still positive because price is above the SMA20 at HKD 119.88 and above the SMA50 at HKD 111.37.
- Momentum is less convincing: Stochastic is overbought and MACD is below its signal line, which points to cooling upside pressure.
- Volatility is elevated, with ATR at 4.85 and Bollinger bands widening, so the next move may be sharper but not yet clearly directional.
Verdict invalidated if price falls below HKD 119.88, because that would break the short-term trend base and weaken the current bullish structure.
- Ideal Entry Range: HKD 119.88 to 124.20
- Exit Target (Target Price): HKD 128.10, then HKD 132.00
- Stop Loss Protection: HKD 110.00
In plain English: Alibaba’s chart still leans upward, but the momentum is not strong enough yet to treat this as a clean continuation move.
Alibaba’s 20-hour resistance stands at HKD 128.10.
Summary Data Alibaba
| Last price | 124.20 HKD |
| Change 1 day / 5 days / 1 month | 1.64% / -1.74% / 6.15% |
| Trend / MA-cross | uptrend / none |
| SMA20 / SMA50 | 119.88 / 111.37 |
| RSI (14) / Stochastic %K | 61.5 / 82.0 |
| Bollinger %B / ATR | 68% / 4.85 |
| Support / Resistance 20 days | 110.00 / 128.10 |
| Data as of | 18 Agustus 2026 08:30 WIB |
Track Alibaba share price daily: live levels, support/resistance and our full Alibaba analysis history.