DIS Stock Technicals Today: Gains 2.87%, Golden Cross Formed
On Agustus 20, 2026: price 106.93 USD, trend uptrend, RSI 63.6, support 92.83, resistance 106.93. technical analysis of dis stock. DIS Stock Technicals — full…

Walt Disney shares closed at 106.93 USD on 19 August 2026, up 2.87% on the day, extending a 11.54% one-month advance and leaving the stock pressed against the top of its recent trading range. The move matters because it is not just a one-day bounce: Disney is now trading above both its short- and medium-term trend lines, while momentum tools are sending a more cautious message. As shown in the chart, price is advancing, but it is also approaching a zone where gains have recently become harder to sustain.
Trend & Price Action
The broader setup remains constructive. Disney is in an uptrend, with the SMA20 at 100.88 rising at 2.03% over five days and the stock holding above both the SMA20 and SMA50 at 99.52. The golden cross — where the shorter average moves above the longer one — is a classic signal that recent buying pressure has begun to overpower the prior trend. In plain terms, it suggests the market is willing to pay more for Disney now than it was a few weeks ago, and that the trend has shifted from defensive to supportive.
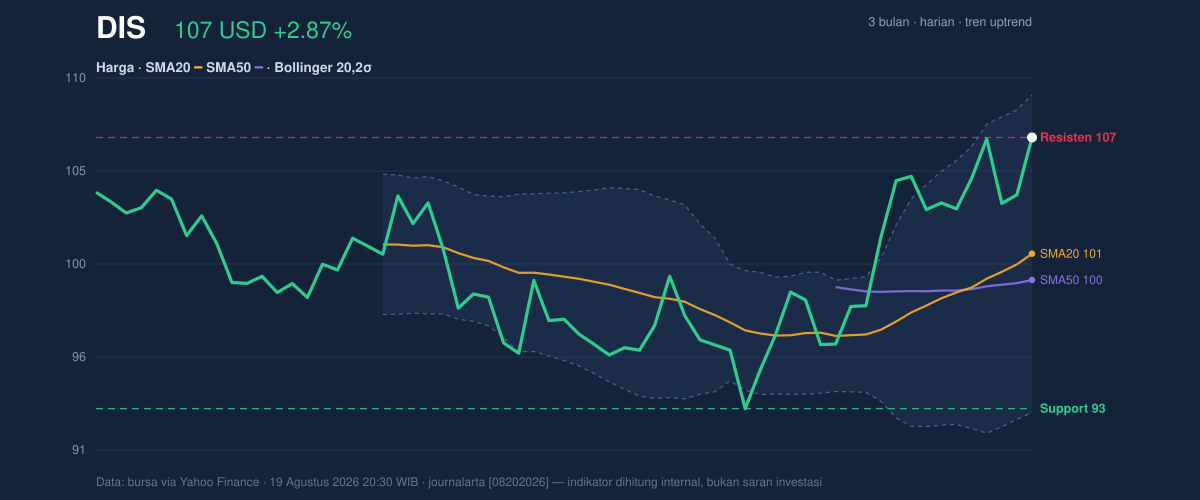
What makes this move more interesting is where it sits in the range. The stock is at 100% of its 20-day range, with 20h resistance at 106.93 and the 3-month high at 107.11. That means Disney is effectively testing the ceiling, not cruising comfortably below it. When a stock spends time near the top of its range, it often signals strength — but also raises the risk of pause or pullback if fresh demand does not arrive.
A short line matters here: this is strength, but it is stretched strength.
Oscillators & Momentum
Momentum is positive, though not perfectly aligned. The MACD at 2.002 sits above its signal line at 1.455, with a 0.548 histogram. That combination usually means the trend is still gaining traction; the histogram above zero suggests the recent pace of gains is stronger than the slower trend measure, which supports the idea that buyers remain in control. In practical terms, MACD is confirming the breakout attempt rather than warning against it.
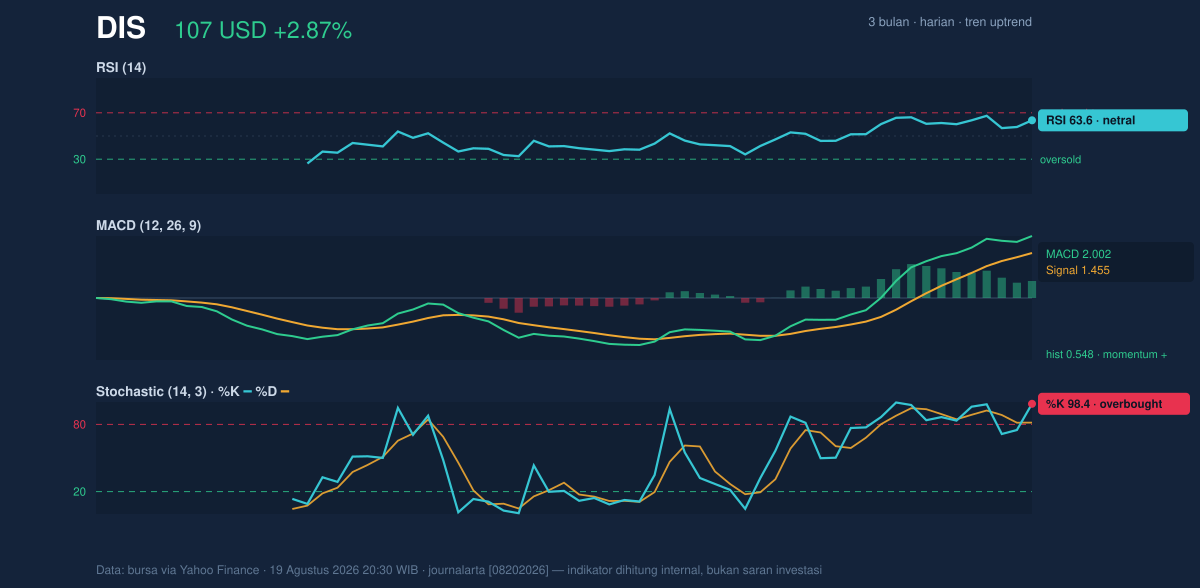
The caution comes from the faster oscillators. The RSI at 63.6 is still technically neutral, which means the stock is not yet in an extreme zone. But the Stochastic %K at 98.4 and %D at 81.6 are both in overbought territory. That does not mean the stock must fall; it means short-term buying has been intense enough that the next move could be choppier. Overbought readings are often a sign of momentum, but they also tell traders that the easy part of the move may already be behind the stock.
This is the key tension in Disney right now: trend confirmation from MACD, but near-term exhaustion risk from Stochastic.
Volatility & Volume
Volatility is present, but not alarming. The Bollinger Bands show an upper band at 109.14, a middle band at 100.88, and a lower band at 92.63, with a 16.4% band width described as normal. That matters because a normal band width suggests the stock is not in a volatility squeeze that typically precedes a sharp expansion, nor is it in a disorderly spike. Instead, Disney is moving within a workable but active range. With %B at 87%, price is trading close to the upper band, which reinforces the message from the range data: the stock is near the top of its channel and may need either a clean breakout or a consolidation phase.
Volume tells a more restrained story. Last volume was 8,039,100, below the 20-day average of 11,218,460, or about 0.7x normal. That is important because a move toward resistance on lighter volume can be less convincing than one backed by broad participation. Still, OBV is rising, which means cumulative volume flow has been improving even if the latest session did not bring a surge. In simple terms, investors have been accumulating over time, but not aggressively enough in the latest session to fully validate a breakout.
Key Levels & Scenarios
The immediate battlefield is tight. 106.93 is both the last price and the current 20h resistance, while the next obvious overhead reference is the 3-month high at 107.11. On the downside, the first meaningful support is 100.88, which also matches the SMA20 and the Bollinger middle band. Below that, the 20h support at 92.83 sits just above the 3-month low at 92.49, creating a clear lower boundary for the recent structure.
If Disney can hold above 100.88 and keep momentum intact, the chart suggests a continuation attempt toward 109.14, the Bollinger upper band. If it fails to remain above that support, the recent advance would start to look more like an overextended move rather than a durable trend change.
Technical Verdict: HOLD (wait & see)
HOLD (wait & see)
- MACD remains positive, which supports the trend and shows momentum is still constructive.
- Golden cross plus price above SMA20 and SMA50 confirms the medium-term structure is still upward.
- Stochastic is overbought and price is already near the 3-month high, so the stock may need to cool off before proving the breakout.
- Verdict is invalidated if price falls below 100.88, which would break the SMA20 and the Bollinger middle band.
- Ideal Entry Range: 100.88 to 106.93
- Exit Target: 109.14
- Stop Loss Protection: 92.83
In plain English: Disney looks strong, but it is close enough to resistance that the next move matters more than the last one.
“The stock is pressing the ceiling — and the market still has to prove it can go through.”
Summary Data DIS
| Last price | 106.93 USD |
| Change 1 day / 5 days / 1 month | 2.87% / 3.59% / 11.54% |
| Trend / MA-cross | uptrend / golden |
| SMA20 / SMA50 | 100.88 / 99.52 |
| RSI (14) / Stochastic %K | 63.6 / 98.4 |
| Bollinger %B / ATR | 87% / 2.28 |
| Support / Resistance 20 days | 92.83 / 106.93 |
| Data as of | 19 Agustus 2026 20:30 WIB |
Track DIS stock price daily: live levels, support/resistance and our full DIS analysis history.