MELI Stock Technicals Today: Gains 7.28%, Momentum Weakens
On Agustus 20, 2026: price 1,908.65 USD, trend sideways, RSI 57.8, support 1,779.14, resistance 1,940.00. technical analysis of meli stock.

For international readers, MercadoLibre’s latest move shows a stock still climbing, but doing so with momentum that is starting to look stretched rather than cleanly confirmed.
MercadoLibre, traded on NASDAQ under MELI, closed at 1,908.65 USD, up 7.28% on the day after a 1,779.14 previous close, according to Yahoo Finance data cited on 19 August 2026 at 20:30 WIB. That push lifted the shares above the SMA20 at 1,850.54 and well above the SMA50 at 1,776.78, which tells investors the medium-term trend remains constructive even though the broader pattern is still described as sideways. In plain terms, the stock has moved back into the upper half of its recent range, but it has not yet broken into a decisive new trend.
The key signal is that price is holding above both moving averages without a fresh crossover.
That usually means the market is improving, but not yet fully committing.
Trend & Price Action
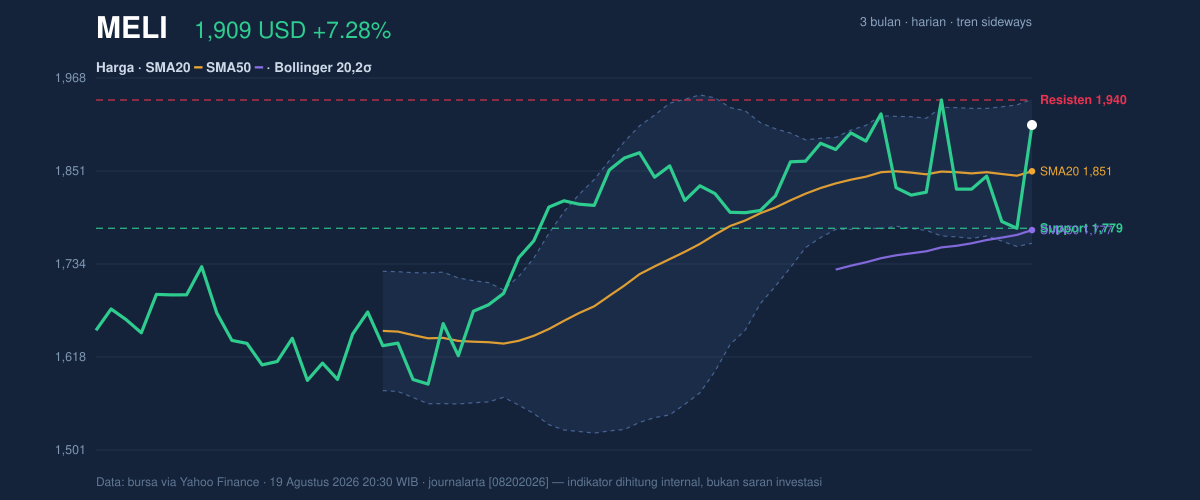
As shown in the chart, MELI is trading in the upper part of its recent band, at about 81% of the 20-hour range, with 1,779.14 acting as support and 1,940.00 as near-term resistance. The stock is also close to its 3-month high of 1,946.00, which matters because markets often pause near prior peaks as traders test whether the move has enough sponsorship to continue. The fact that the SMA20 slope is only 0.06% over 5 days is important: it signals that the trend is not accelerating strongly, even though price has pushed higher. In other words, the chart is firm, but not yet forceful.
The move above the SMA20 is a positive sign because short-term traders often watch that line as a rough dividing point between weakness and recovery. With price also above the SMA50, the longer lens is still supportive. However, the absence of a new MA-cross suggests the market has not generated a fresh trend signal; it is recovering within an existing structure rather than launching a new one.
Oscillators & Momentum
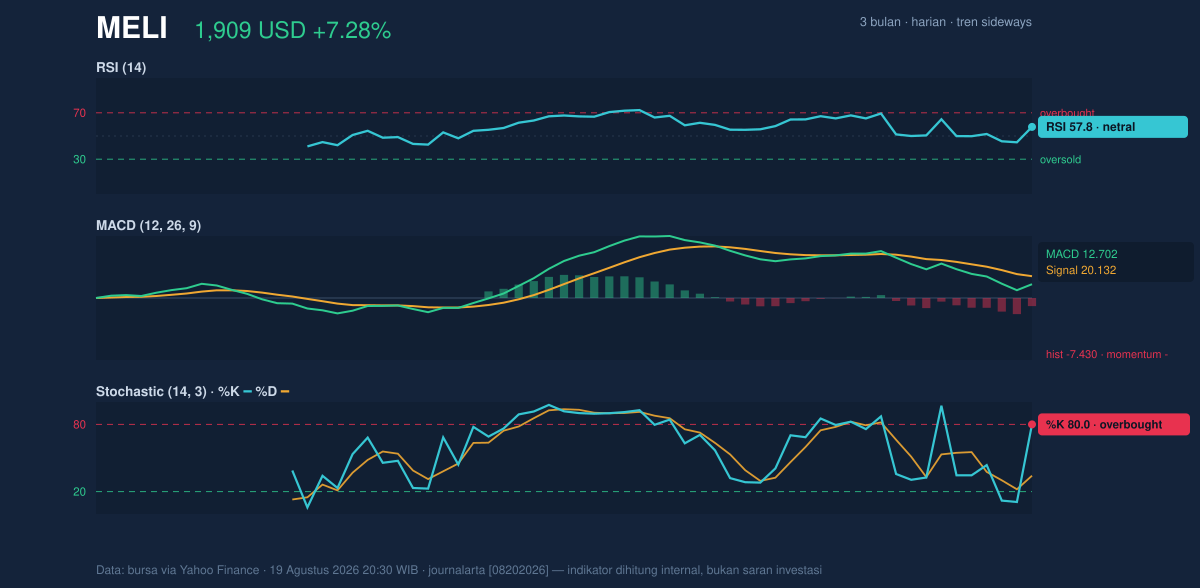
Momentum is more mixed than price alone suggests. The RSI at 57.8 is neutral, which means the stock is neither deeply overbought nor oversold. That is useful because it shows the rally has not yet reached an extreme on this measure. But the Stochastic %K at 80.0 versus %D at 34.2 points to an overbought reading, implying the recent rise may be moving faster than the underlying trend can comfortably sustain. Stochastic is a short-term timing tool, so when it reaches this zone while price is near resistance, it often warns that the stock may need to cool off.
The more cautionary signal comes from the MACD at 12.702, below its signal line at 20.132, with a -7.430 histogram. That combination means upside momentum is still lagging the pace of the recent price move. Put simply, the stock is rising, but the internal momentum gauge has not kept up. When MACD stays negative while price pushes toward resistance, rallies can become vulnerable to pauses or pullbacks.
The chart is not bearish. It is less convincing than the price action.
Volatility & Volume
MELI’s ATR(14) of 74.24, equal to 3.9% of price, says daily swings remain elevated. That matters because a stock trading near resistance with high ATR can move quickly in either direction once traders commit. The Bollinger Bands reinforce that message: the upper band sits at 1,940.84, almost exactly where price is approaching resistance, while %B at 82% shows the stock is trading high within the band structure. The band width of 9.8% is described as normal, so this is not a compression setup waiting for an explosive release; rather, it is a standard volatility environment with room for movement but no clear squeeze signal.
Volume adds another layer of caution. Last volume was 707,600, about 1.5x the 20-hour average of 479,150, which means the latest rise had real participation. Yet OBV is down, and that divergence matters: On-Balance Volume tracks whether trading flow is broadly accumulating or distributing. A falling OBV while price rises can mean the advance is not being confirmed by the broader volume trend. That does not invalidate the rally, but it does weaken the case that buyers have fully taken control.
This is what a mature rally often looks like: strong enough to rise, not strong enough yet to prove itself.
Key Levels & Scenarios
The immediate battleground is clear. 1,940.00 to 1,940.84 is the first ceiling, marked by both the stated resistance and the upper Bollinger Band. A clean move through that area would tell traders the stock is no longer just testing the top of its recent range. On the downside, 1,850.54 at the SMA20 is the first structural support, while 1,779.14 is more important because it is both the 20-hour support and the previous close reference. A failure back below that level would suggest the recent breakout attempt has faded. The broader 3-month floor at 1,546.00 remains far below current trading, so the immediate story is about range pressure, not long-term breakdown risk.
Technical Verdict: HOLD (wait & see)
HOLD (wait & see)
- Price above SMA20 and SMA50 keeps the trend constructive.
- MACD below signal and OBV down show the rally is not fully confirmed.
- Stochastic overbought near 1,940.00 resistance suggests limited room for a clean extension without consolidation.
Verdict invalidated if price falls below 1,779.14.
- Ideal entry range: 1,850.54 to 1,779.14
- Exit target: 1,940.00 to 1,940.84
- Stop loss protection: below 1,760.24
For non-traders: the chart says MELI is strong enough to hold up, but not yet strong enough to prove the rally has fully taken charge.
Summary Data MELI
| Last price | 1,908.65 USD |
| Change 1 day / 5 days / 1 month | 7.28% / 4.40% / 6.08% |
| Trend / MA-cross | sideways / none |
| SMA20 / SMA50 | 1,850.54 / 1,776.78 |
| RSI (14) / Stochastic %K | 57.8 / 80.0 |
| Bollinger %B / ATR | 82% / 74.24 |
| Support / Resistance 20 days | 1,779.14 / 1,940.00 |
| Data as of | 19 Agustus 2026 20:30 WIB |
Track MELI stock price daily: live levels, support/resistance and our full MELI analysis history.