AstraZeneca Stock Gains 2.39% Today, Momentum Gains
On Agustus 21, 2026: price 12,088.00 GBp, trend downtrend, RSI 45.8, support 11,460.00, resistance 13,134.00. technical analysis of astrazeneca stock.

AstraZeneca’s shares on the London Stock Exchange rose to 12,088.00 GBp on 19 August 2026 at 14:00 WIB, up 2.39% from the previous close, but the move still sits inside a broader corrective phase. The stock is trading below its SMA20 at 12,140.70 and well under the SMA50 at 12,916.84, which tells investors the recent bounce has not yet overturned the longer slide. As shown in the chart, the price is also sitting in the lower half of its recent range, with the market still digesting a 1-month decline of 4.83% even after the latest rebound.
Trend & Price Action
The key message from the moving averages is straightforward: the trend remains weak, but it is not collapsing. The downtrend is still in place, and the SMA20 slope of -1.71% over 5 days shows that short-term momentum has been drifting lower rather than turning decisively higher. That matters because a rising daily price can look encouraging on the surface while the trend structure beneath it is still leaning down. There is also no fresh MA-cross, so the chart has not produced the kind of average crossover that would normally signal a more durable change in direction.
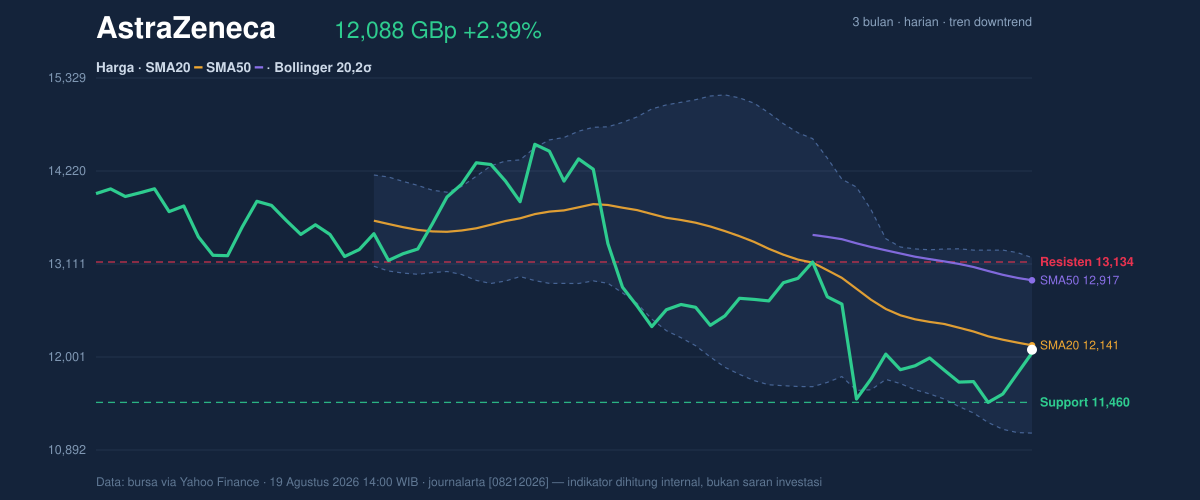
The current price position is important. At 12,088.00 GBp, AstraZeneca is trading just under the 20-day average, which means the latest recovery is testing a line that often acts as a short-term pivot. If the share price can reclaim and hold above that area, it would suggest the recent buyers are beginning to absorb supply. If it cannot, the market is still treating rallies as opportunities to lighten positions rather than as evidence of a full trend reversal. The stock is also only 38% of the way through the 20-week range between 11,460.00 support and 13,134.00 resistance, which places it closer to the lower end of the band than the upper end.
Oscillators & Momentum
Momentum indicators are mixed, and that mix is what makes the current setup more nuanced than the trend alone suggests. The RSI at 45.8 is neutral, meaning the shares are neither stretched to the upside nor oversold. In plain English, the market is not showing the kind of extreme that usually forces a sharp reversal. The Stochastic reading of %K 43.4 and %D 25.4 is also neutral, but the gap between the two lines hints that short-term momentum has improved from weak levels without yet becoming forceful.
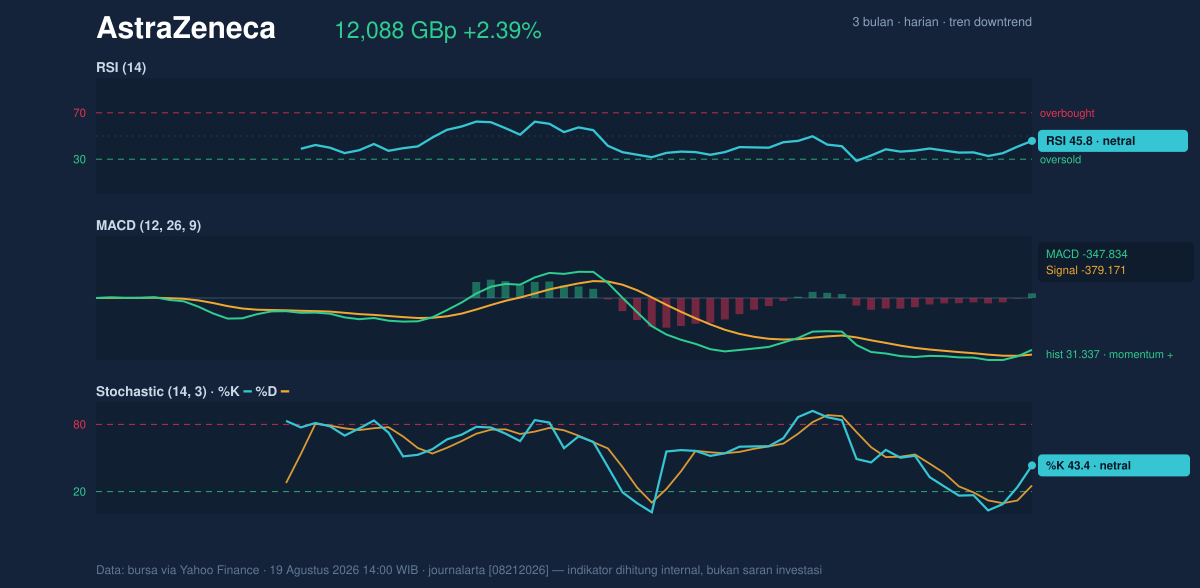
The more constructive signal comes from the MACD at -347.834, which remains below zero but is above its signal line at -379.171. That produces a positive histogram of 31.337, a sign that downside momentum is easing even though the broader trend has not flipped. This is the sort of reading that often appears when a stock is trying to stabilise after a decline: the price is still below key averages, but the internal momentum is no longer as negative as it was. In other words, the chart is showing early repair, not confirmation.
Volatility & Volume
Volatility is moderate rather than explosive. The ATR(14) of 366.23, equal to 3.0% of price, suggests AstraZeneca can still move meaningfully in a session, but not in a disorderly way. The Bollinger Bands reinforce that view. With price at %B 47% and the band width at 17.2%, the shares are sitting near the middle of the envelope and the bands are in a normal state, not squeezed into a breakout setup and not expanding sharply in panic. The middle band at 12,140.70 also lines up with the SMA20, so that zone is a clear technical hinge.
Volume, however, is less convincing. Last traded volume was 3,133,515, which is only 0.7x the 20-day average of 4,550,845. That means the latest advance has not been backed by broad participation. Price gains on lighter volume can still work, but they usually need follow-through to prove that larger holders are involved. The one supportive detail is that OBV is rising, which suggests cumulative buying pressure has been improving even if the day’s turnover was subdued. That combination often points to quiet accumulation rather than a decisive breakout.
Key Levels & Scenarios
The nearest technical floor is 11,460.00. If that level holds, the stock can continue to trade as a range-bound recovery attempt inside a still-soft trend. A failure there would leave the chart vulnerable to another test of the lower part of the 3-month range, with the 9,892.00 low acting as the more distant benchmark of where selling pressure has previously exhausted itself. On the upside, 13,134.00 is the first clear resistance to watch. That level sits just above the current Bollinger upper band at 13,187.44, so a move through resistance would also push the shares toward the top of their recent volatility envelope.
The immediate technical story is therefore not about a breakout, but about whether the stock can keep building on a cautious rebound. A price that remains below the 20-day average while momentum slowly improves can often spend time consolidating before choosing a direction. The chart is saying that sellers have lost some control, but buyers have not yet won it.
Technical Verdict: HOLD (wait & see)
HOLD (wait & see)
- MACD histogram is positive, which shows downside momentum is easing.
- RSI at 45.8 and Stochastic at 43.4 / 25.4 are neutral, so the move is improving but not confirmed.
- Price remains below SMA20 at 12,140.70 and SMA50 at 12,916.84, so the broader trend is still down.
- Verdict invalidated if price breaks below 11,460.00.
- Ideal Entry Range: 11,460.00 to 12,140.70
- Exit Target: 13,134.00
- Stop Loss protection: below 11,460.00
For non-traders, that means the shares are improving, but the chart has not yet shown enough strength to call the decline over.
AstraZeneca’s 3-month high stands at 15,126.00.
Summary Data AstraZeneca
| Last price | 12,088.00 GBp |
| Change 1 day / 5 days / 1 month | 2.39% / 3.30% / -4.83% |
| Trend / MA-cross | downtrend / none |
| SMA20 / SMA50 | 12,140.70 / 12,916.84 |
| RSI (14) / Stochastic %K | 45.8 / 43.4 |
| Bollinger %B / ATR | 47% / 366.23 |
| Support / Resistance 20 days | 11,460.00 / 13,134.00 |
| Data as of | 19 Agustus 2026 14:00 WIB |
Track AstraZeneca share price daily: live levels, support/resistance and our full AstraZeneca analysis history.