AVGO Stock Technicals Today: Gains 0.43%, Testing Support Level
On Agustus 21, 2026: price 364.03 USD, trend sideways, RSI 36.3, support 362.48, resistance 427.76. technical analysis of avgo stock. AVGO Stock Technicals —…

Broadcom is trading in a market that has turned defensive fast: the shares are near the lower end of their recent range, momentum has weakened, and the chart is now asking whether oversold conditions can stabilise the slide or merely delay it.
Broadcom Inc. on Nasdaq closed at 364.03 USD, up 0.43% on the day, but that modest bounce sits inside a larger pullback of -12.87% over five days and -7.25% over one month. That contrast matters. A single positive session can look encouraging in isolation, yet when it arrives after a sharp short-term drop, it often signals only that sellers are pausing rather than reversing course.
Trend & Price Action
The price is still below both major short-term trend markers, with price under the SMA20 at 396.74 and also below the SMA50 at 388.58. In plain terms, the stock is trading beneath the average prices of the past month and past ten weeks, which tells investors that recent buying has not been strong enough to reclaim control.
The broader structure is described as sideways, but that label can be deceptive when the slope of the SMA20 is still -0.41% over five days. A sideways market with a declining short-term average usually means consolidation is happening under pressure, not in balance. The chart also shows no fresh MA-cross, so there is no new moving-average confirmation of a trend change.
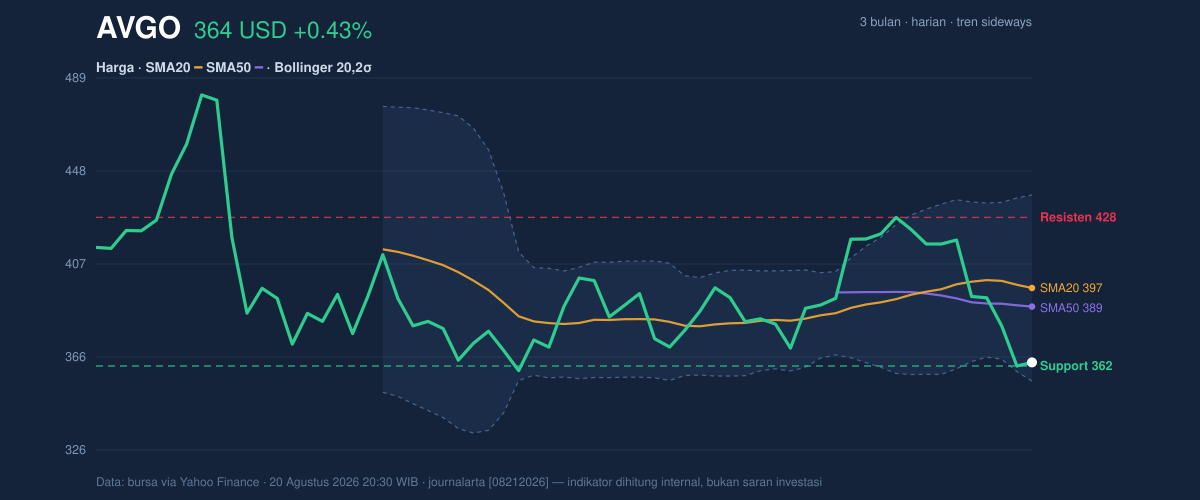
The Bollinger Bands help frame where the stock sits in that pressure zone. Broadcom is near the lower band, with %B at 10% and the lower band at 355.84. %B at 10% means the share price is hugging the bottom of its recent statistical range, which often marks stretched downside conditions. But the band width has expanded to 20.6%, a sign that volatility is elevated and the market is willing to travel farther than usual in either direction. In other words, the chart is not calm; it is primed.
The stock is also trading just above the 20-hour support at 362.48, and the last price is only about 2% above that level. That is a narrow cushion. The 20-hour resistance stands at 427.76, far above the current quote, which shows how much work would be needed to restore the prior trading structure. The 3-month high and low, 495.00 and 356.43, place the share price much closer to the lower boundary than the upper one.
Oscillators & Momentum
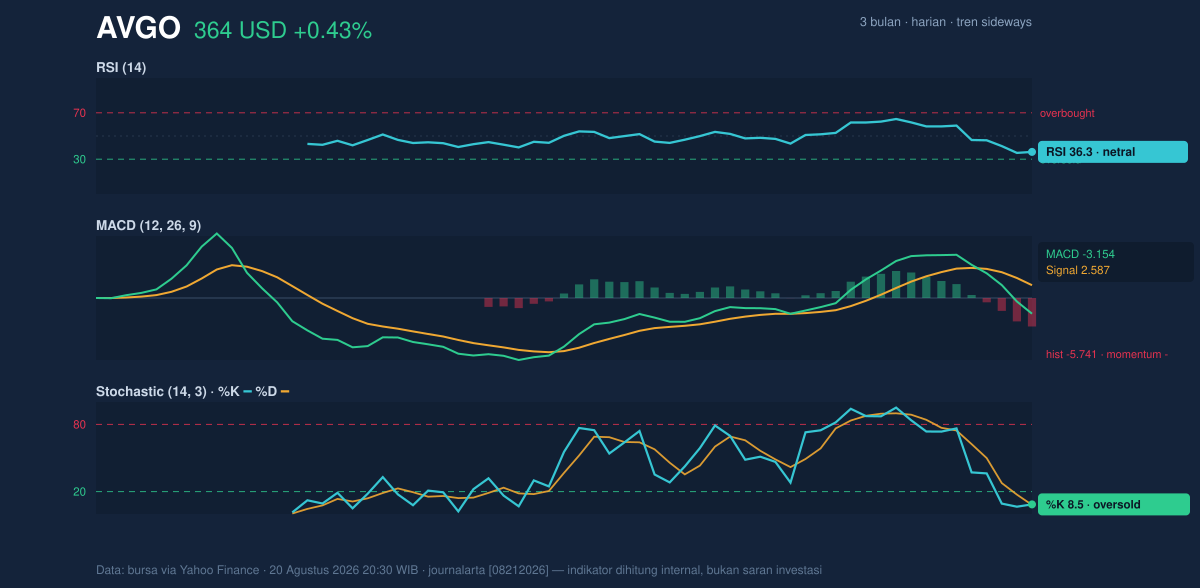
Momentum indicators are split, but not in a way that favours a clean recovery yet. The RSI at 36.3 is still technically neutral, though it is moving closer to the oversold zone. That matters because RSI measures whether losses have become extended; at this level, the stock is not yet washed out enough to call a full exhaustion signal, but it is approaching territory where rebounds often begin to appear.
The more immediate short-term oscillator is stronger in its warning. The Stochastic %K at 8.5 and %D at 8.1 both sit in oversold territory. Stochastic compares the latest price to its recent range, so readings this low say the stock is closing near the lower end of that range and has been doing so for several sessions. That is often what a weak tape looks like just before a bounce attempt, but it is not a bounce confirmation by itself.
The MACD at -3.154, with the signal line at 2.587 and the histogram at -5.741, is the clearest bearish signal in the set. MACD tracks the relationship between faster and slower price trends. When it is below the signal line and the histogram is deeply negative, downside momentum still dominates. That means any rebound attempt is currently fighting the prevailing trend rather than riding it.
Volatility & Volume
Volume adds an important layer. The latest volume of 19,691,700 is almost exactly in line with the 20-hour average of 19,737,230, or 1.0x normal. That tells us the recent decline is not being driven by panic volume, but neither is there strong accumulation to suggest buyers are stepping in aggressively. The OBV is falling, which is a quiet but important warning: on-balance volume tracks whether trading pressure is favouring buyers or sellers over time, and a decline says the tape has been distributing shares rather than absorbing them.
ATR, or average true range, is 15.50, equal to 4.3% of price. That is a high-volatility reading. It means Broadcom can move meaningfully in either direction in a single session, so levels matter more than headlines. With the Bollinger Bands widening and ATR elevated, the market is signalling that the next move could be sharp even if it starts from a narrow base.
Key Levels & Scenarios
The immediate reference points are straightforward. Support at 362.48 is the closest line in the sand, while the lower Bollinger band at 355.84 and the 3-month low at 356.43 form the next downside cluster. On the upside, the first meaningful hurdle remains the SMA50 at 388.58, then the SMA20 at 396.74, with 427.76 as the broader resistance band shown on the chart.
If the stock holds above 362.48 and momentum indicators begin to turn up from oversold territory, the current setup would look more like a volatility rebound than a trend reversal. If it loses 355.84 or the 356.43 area, the chart would be signalling that the recent low has failed and that sellers still control the tape.
Technical Verdict: HOLD (wait & see)
HOLD (wait & see)
- Stochastic is oversold, which raises the odds of a short-term bounce, but it is not enough on its own to confirm a trend turn.
- MACD remains negative and the histogram is deeply below zero, showing that downside momentum is still active.
- Price is below the SMA20 and SMA50, so the stock has not yet reclaimed its short-term trend structure.
Verdict invalidated if price breaks below 355.84.
- Ideal Entry Range: 355.84 to 362.48
- Exit Target: 388.58 to 396.74
- Stop Loss protection: below 355.84
For non-traders, this means the chart is stretched enough for a rebound, but the broader trend is still pointing lower until price proves otherwise.
The latest 20-hour support is 362.48.
Summary Data AVGO
| Last price | 364.03 USD |
| Change 1 day / 5 days / 1 month | 0.43% / -12.87% / -7.25% |
| Trend / MA-cross | sideways / none |
| SMA20 / SMA50 | 396.74 / 388.58 |
| RSI (14) / Stochastic %K | 36.3 / 8.5 |
| Bollinger %B / ATR | 10% / 15.50 |
| Support / Resistance 20 days | 362.48 / 427.76 |
| Data as of | 20 Agustus 2026 20:30 WIB |
Track AVGO stock price daily: live levels, support/resistance and our full AVGO analysis history.