KO Stock Analysis: Gains 0.17%, Testing Key Resistance
On Agustus 21, 2026: price 90.50 USD, trend uptrend, RSI 68.8, support 82.25, resistance 90.50. technical analysis of ko stock. KO Stock Analysis — full…

At $90.50, Coca-Cola is pressing right up against the top of its short-term range, with the stock 0.17% higher on the day and 11.49% higher over the past month, according to Yahoo Finance data cited at 20 August 2026 20:30 WIB. The message from the chart is straightforward: the trend is still pointing up, but the move has become extended, leaving less room for easy follow-through and more room for hesitation near resistance.
Trend & Price Action
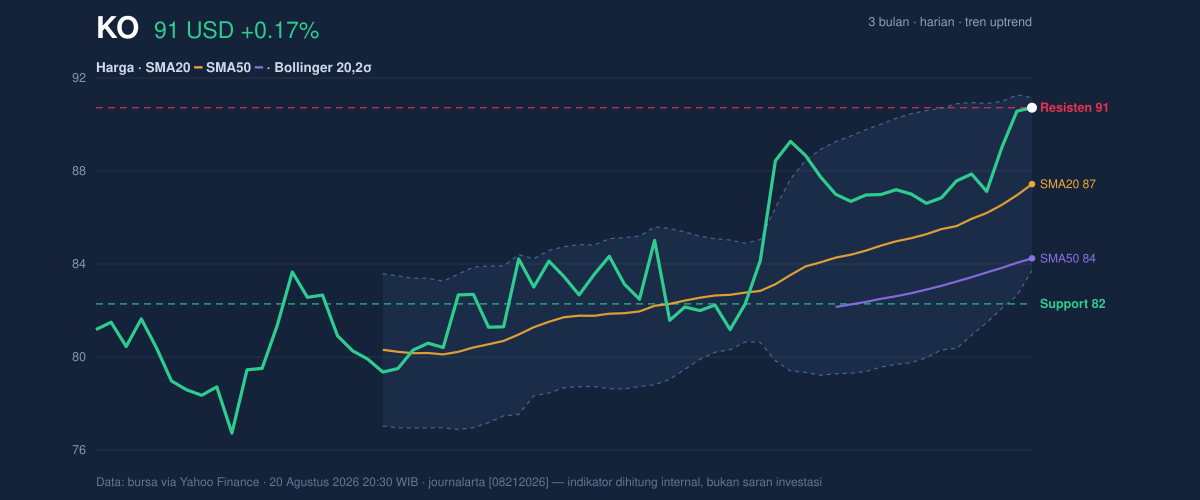
KO remains in an established uptrend, and that matters because the current move is not happening in isolation; it is happening above both the SMA20 at $87.29 and the SMA50 at $84.16. When price sits above both short- and medium-term averages, it usually signals that recent buyers are still in control and that dips have been getting absorbed rather than punished. The SMA20 slope of 2.07% over 5 days reinforces that point: the near-term trend is not just positive, it is accelerating modestly.
The more important detail is where price sits inside the range. KO is at 100% of its 20-hour range, with support at $82.25 and resistance at $90.50. That means the stock is effectively testing the ceiling, not building a base below it. As shown in the chart, the price has already pushed to the upper edge of the 3-month high at $91.87, so the market is now asking whether this is a breakout attempt or simply a pause after a strong run.
That matters because stocks often behave differently at the top of a range: momentum can carry them higher, but the margin for error narrows quickly.
Oscillators & Momentum
The momentum indicators are supportive, but they also hint that KO is no longer in an early-stage move. The RSI at 68.8 is labeled neutral in the dataset, but in practical terms it sits close to the upper end of the scale, which usually means the stock is getting stretched rather than oversold. That is not a sell signal by itself; it is a sign that buyers have already done a lot of the work, so fresh upside may need a new catalyst or a clean technical break.
The Stochastic %K at 79.6 and %D at 89.5 is also marked neutral, yet the structure suggests momentum is elevated and somewhat mature. When the fast line sits below the slow line while both are near the upper band of the range, it often means upside pressure is still present but no longer expanding as freely. In plain language: the stock is strong, but it may be running a little hot.
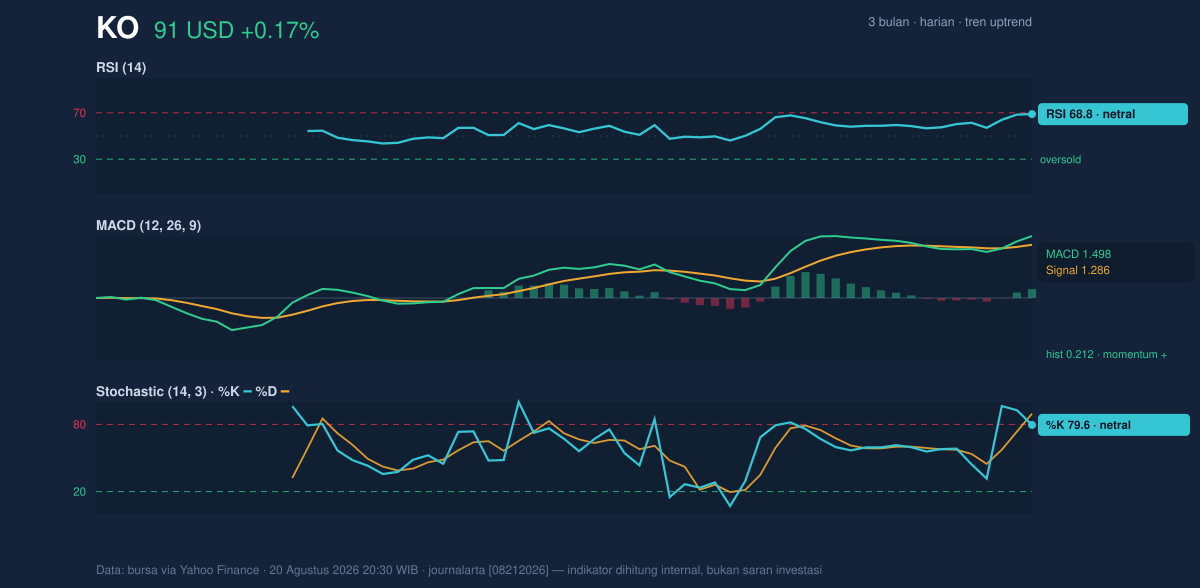
The more convincing signal is the MACD at 1.498 above its signal line at 1.286, with a positive histogram of 0.212. MACD is a trend-following tool, and this positive spread means the recent price trend is still outrunning its own average pace. In other words, the trend has not merely survived the rally; it is still confirming it.
Volatility & Volume
Volatility is present, but not extreme. The ATR(14) at 1.43, equal to 1.6% of price, points to moderate volatility. That is important because it suggests KO can still move, but not in the kind of disorderly fashion that often accompanies panic or speculative bursts. The Bollinger Band width of 8.3% is described as normal, which means the stock is not in a squeeze that would usually precede a sharp expansion, nor is it in a panic widening that would imply stress. Price is simply sitting near the top rail, with %B at 94%, a reading that shows KO is trading very close to the upper Bollinger Band at $90.92.
That combination is worth reading carefully. A high %B does not automatically mean reversal; it means price is hugging the upper band, which often happens in strong trends. But when that occurs alongside a near-term resistance test, it also tells you the move is already well advanced.
Volume does not yet confirm a decisive breakout. The latest volume of 14,921,900 is only 0.9x normal versus the 20-hour average of 15,954,030. That is a subtle warning sign: the stock is making a strong technical push without a clear surge in participation. Still, OBV is rising, and that matters because on-balance volume tracks whether money is steadily accumulating over time. Rising OBV says the broader flow of shares has been constructive, even if today’s trading is not especially heavy.
Key Levels & Scenarios
The chart leaves a fairly clean map. Immediate resistance is the current high at $90.50, with the next notable ceiling at the 3-month high of $91.87. On the downside, the nearest technical cushion is the Bollinger middle band and SMA20 at $87.29, followed by the deeper support at $82.25. If KO can hold above $87.29, the trend remains comfortably intact; if it slips back below that area, the market would be signaling that the recent extension is fading and that the rally may need to reset.
In practical terms, the stock is still trending upward, but it is now testing whether momentum can outrun a fully extended short-term setup.
Technical Verdict: HOLD (wait & see)
HOLD (wait & see)
- MACD is positive and still above its signal line, which confirms the uptrend is active.
- Price is above SMA20 and SMA50, so the broader technical structure remains constructive.
- %B at 94% and price at the top of the range suggest the move is extended near resistance, while volume is only 0.9x normal.
Verdict invalidated if price breaks below $87.29, because that would mean KO has lost the SMA20/Bollinger midline that is currently supporting the trend.
- Ideal Entry Range: $87.29 to $88.00
- Exit Target: $90.50 to $91.87
- Stop Loss Protection: below $82.25
In plain English, KO still looks technically healthy, but it is sitting at a point where the chart is asking for confirmation rather than chase.
Summary Data KO
| Last price | 90.50 USD |
| Change 1 day / 5 days / 1 month | 0.17% / 3.52% / 11.49% |
| Trend / MA-cross | uptrend / none |
| SMA20 / SMA50 | 87.29 / 84.16 |
| RSI (14) / Stochastic %K | 68.8 / 79.6 |
| Bollinger %B / ATR | 94% / 1.43 |
| Support / Resistance 20 days | 82.25 / 90.50 |
| Data as of | 20 Agustus 2026 20:30 WIB |
Track KO stock price daily: live levels, support/resistance and our full KO analysis history.