Testing Key Resistance, BP Stock Gains 3.51% Today
On Agustus 21, 2026: price 552.20 GBp, trend sideways, RSI 56.5, support 514.90, resistance 555.90. technical analysis of bp stock. Testing Key Resistance —…

BP plc is trading near the top of its recent range, but the tape is still sending mixed signals: price is above short- and medium-term averages, while momentum has not fully confirmed the move.
BP’s London-listed shares last changed hands at 552.20 GBp, up 3.51% on the day and above the previous close of 533.50 GBp, according to the exchange data cited through Yahoo Finance. That puts the stock close to a familiar decision point: the market has pushed it into the upper end of its short-term band, but not yet into a clean breakout.
Trend & Price Action
The first thing to note is that BP is still in a sideways trend, even after the latest lift. That matters because a sideways market usually means investors are still weighing competing narratives rather than committing to a new direction. The slope of the SMA20 at 0.19% over 5 days is only mildly positive, which signals stabilization rather than a strong trend.
BP is trading above the SMA20 at 533.05 and also comfortably above the SMA50 at 511.42. In plain terms, the share price is now sitting above both its short- and medium-term averages, a constructive sign that recent buying has been enough to keep price structure intact. But there is no fresh MA-cross, so the chart has not produced the kind of moving-average confirmation that often marks a more durable trend shift.
The Bollinger setup, as shown in the chart, adds an important nuance.
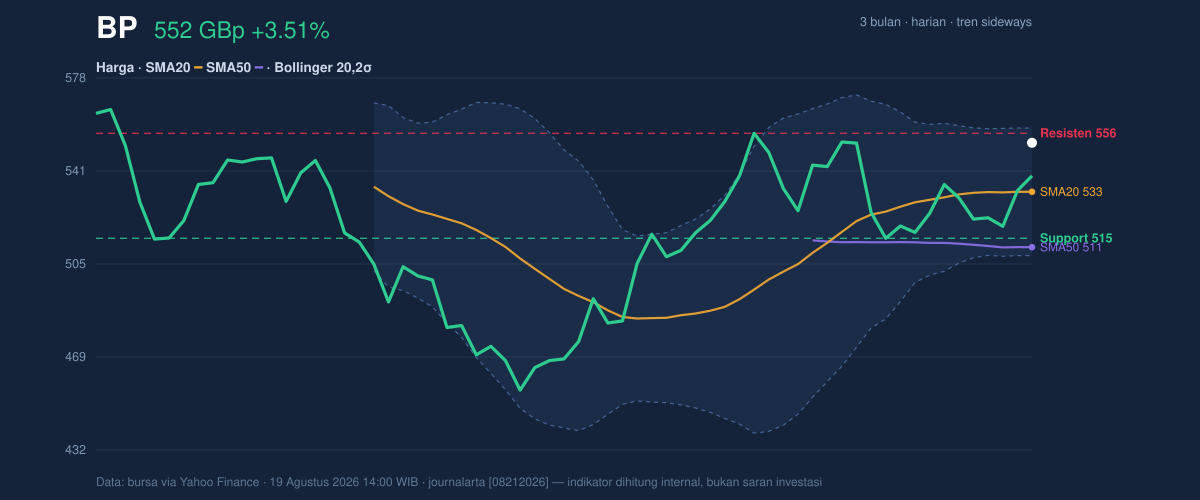
BP is close to the upper band at 557.97, with a %B of 88%. %B measures where price sits inside the Bollinger envelope; at 88%, the share is pressing near the top of its recent statistical range. That usually tells readers the market is not cheap relative to its recent trading pattern, but it does not automatically mean reversal. It simply means there is less room before the upper boundary starts to matter.
The stock is also trading at about 91% of the 20-hour range, with support at 514.90 and resistance at 555.90. That is a tight position near resistance, which makes the next few sessions more about whether buyers can absorb supply than about whether the move has already “won.”
Oscillators & Momentum
The momentum picture is more cautious than the price action. The RSI at 56.5 is neutral, which means BP is neither overbought nor oversold. That is important: the share price has advanced, but the RSI has not pushed into a strongly stretched zone. In other words, the rally has room, but it is not yet strong enough to be called emphatic.
The Stochastic %K at 52.7 and %D at 35.7 are also neutral, though %K being above %D suggests near-term momentum has improved from earlier weakness. This is a modest positive, not a full confirmation.
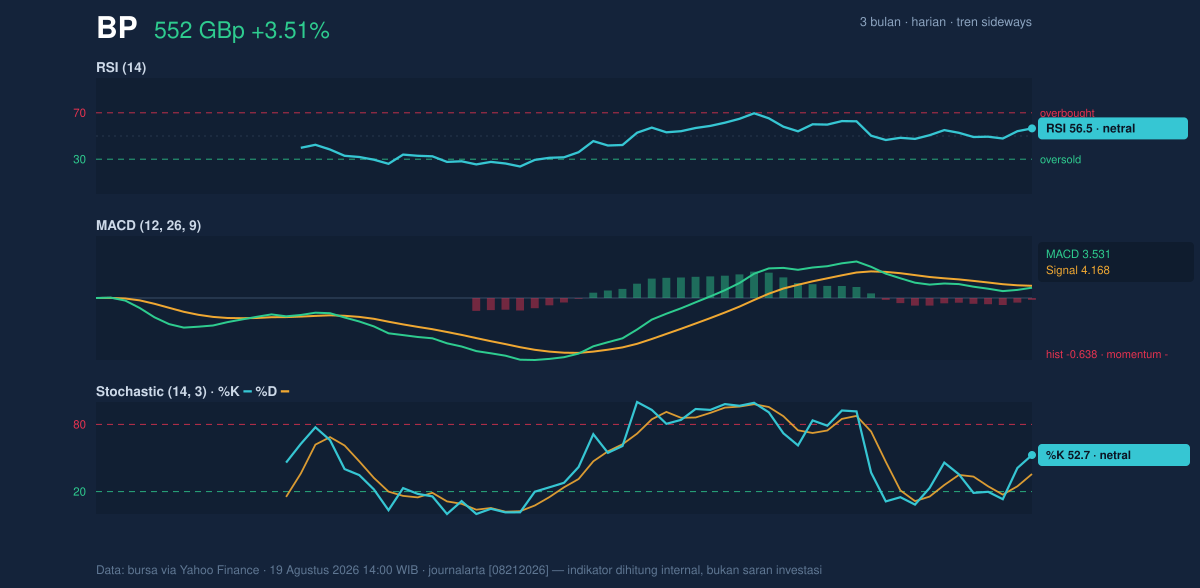
The clearest warning comes from MACD. BP’s MACD at 3.531 is below its signal line at 4.168, leaving a histogram of -0.638. That negative histogram means upside price action is arriving before the trend-following momentum has turned fully supportive. Put simply, the shares have bounced, but the MACD says the bounce is still working through residual weakness. When price is near resistance and MACD remains negative, traders often interpret that as a market that needs more proof before it can extend cleanly.
Volatility & Volume
Volatility is not screaming. The ATR(14) of 14.70, equal to 2.7% of price, points to moderate volatility. That suggests BP can still move meaningfully, but the market is not in a disorderly swing regime. The Bollinger band width of 9.4% is described as normal, which reinforces the idea that this is a measured, not explosive, setup.
Volume is where the latest move looks less convincing. Last trade volume was 31,357,858, well below the 20-hour average of 52,771,410, or about 0.6x normal. Thin volume on an advance often means the move is not yet broadly sponsored. That does not negate the rise, but it does reduce the quality of the signal. The encouraging counterweight is that OBV is rising, which suggests cumulative buying pressure has been improving even if the most recent session was quiet.
In plain English: the market is leaning upward, but participation has not fully caught up with price.
Key Levels & Scenarios
The immediate technical map is fairly clear. Resistance at 555.90 and the Bollinger upper band at 557.97 sit almost on top of each other, making the mid-550s a real test. Above that, the 3-month high at 575.70 becomes the next obvious reference point. On the downside, support at 514.90 and the SMA20 at 533.05 define the first layer of defense, while the SMA50 at 511.42 sits just below the 20-hour support zone as a broader trend floor.
If BP can clear and hold above the 555.90–557.97 area, the chart would begin to look less like a range trade and more like an attempt to revisit the 575.70 peak. If it fails there, the more likely reading is that the stock remains range-bound and drifts back toward the 533.05 area, where the short-term average may again act as a magnet.
Technical Verdict: HOLD (wait & see)
HOLD (wait & see) is the clearest reading from the current chart because price is constructive, but momentum and participation are not yet fully aligned.
- Reason 1: Price is above SMA20 and SMA50, which supports the current structure.
- Reason 2: MACD remains below its signal line, so momentum has not fully confirmed the rise.
- Reason 3: Volume is only 0.6x average, which weakens the quality of the latest push even though OBV is rising.
- Verdict invalidated if price breaks below 514.90, because that would put the stock back under key short-term support and weaken the current range structure.
- Ideal Entry Range: 533.05 to 514.90, where the SMA20 and support zone may offer a more balanced risk-reward setup.
- Exit Target: 555.90 to 557.97 initially, with 575.70 as the next chart reference if resistance gives way.
- Stop Loss protection: below 511.42, which sits near the SMA50 and would signal a more meaningful loss of trend support.
For non-traders, this means BP’s chart is improving, but the market still wants proof before treating the move as more than a rebound.
Summary Data BP
| Last price | 552.20 GBp |
| Change 1 day / 5 days / 1 month | 3.51% / 4.05% / 2.39% |
| Trend / MA-cross | sideways / none |
| SMA20 / SMA50 | 533.05 / 511.42 |
| RSI (14) / Stochastic %K | 56.5 / 52.7 |
| Bollinger %B / ATR | 88% / 14.70 |
| Support / Resistance 20 days | 514.90 / 555.90 |
| Data as of | 19 Agustus 2026 14:00 WIB |
Track BP share price daily: live levels, support/resistance and our full BP analysis history.