COST Stock Gains 2.50% Today, Golden Cross Formed
On Agustus 25, 2026: price 971.40 USD, trend uptrend, RSI 57.5, support 933.51, resistance 974.03. technical analysis of cost stock. COST Stock Gains — full…
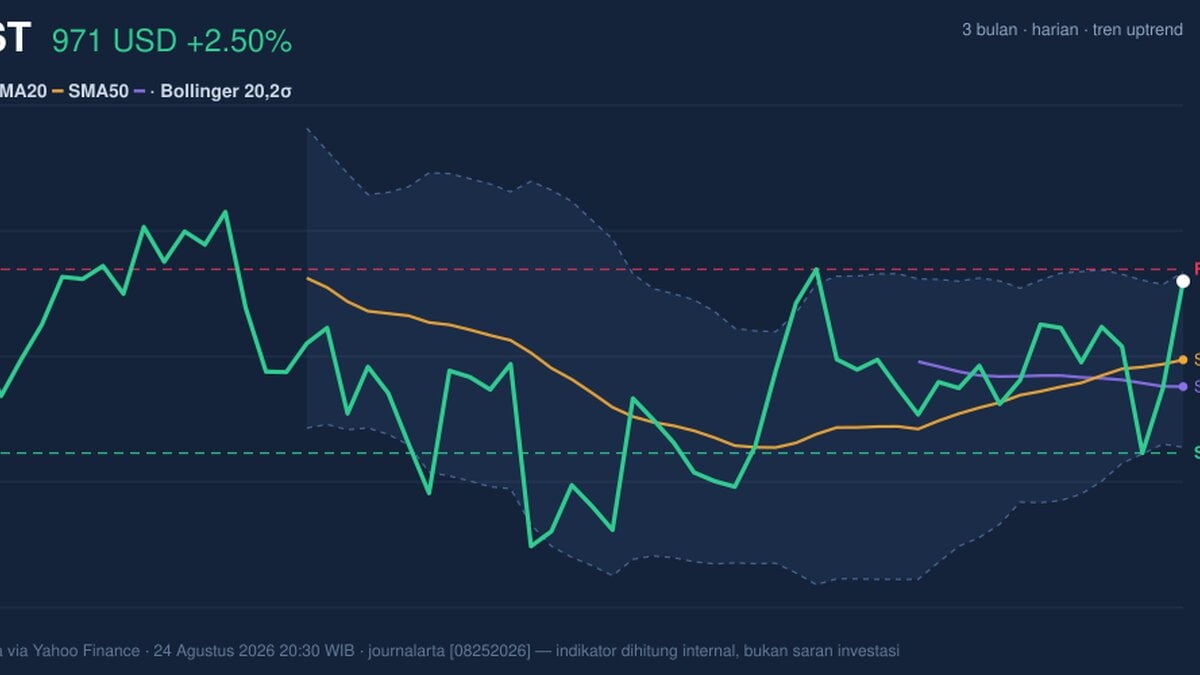
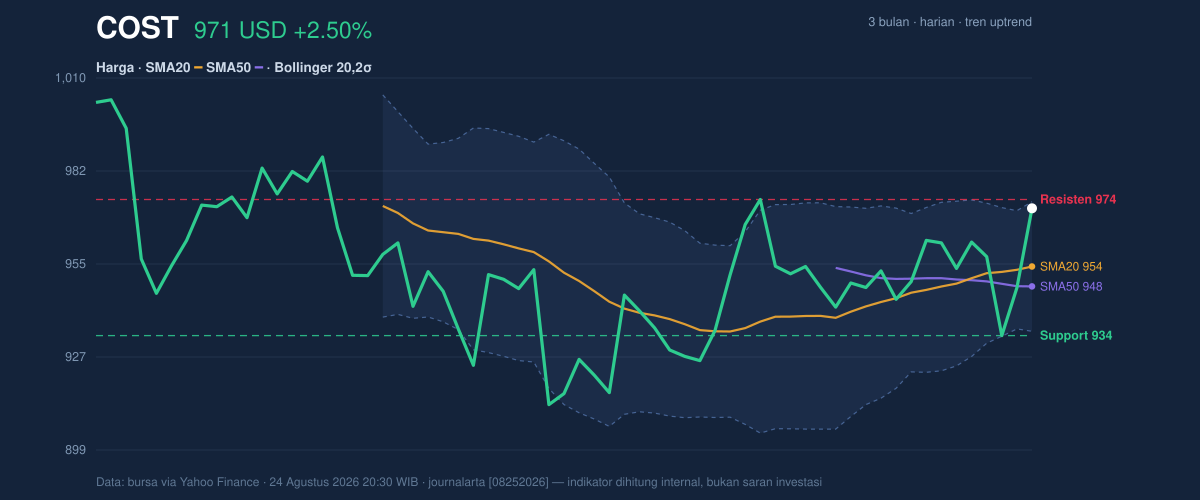
Costco Wholesale Corp. (COST) on the Nasdaq climbed to 971.40 in New York trading, up 2.50% from the previous close of 947.74, as the stock pressed back toward the top of its recent range and tested a familiar ceiling near the upper Bollinger band, according to exchange data and Yahoo Finance market figures. The move matters because COST is not merely rising; it is doing so while sitting above both its short- and medium-term trend lines, a setup that suggests buyers still control the tape even as momentum starts to look stretched.
Trend & Price Action
As shown in the chart, COST is trading above SMA20 at 954.08 and SMA50 at 948.14, with a fresh golden cross in place, meaning the faster average has moved above the slower one. In plain English, that crossover often signals that recent buying pressure has become strong enough to overtake the longer-running trend. The slope of the SMA20 at 0.54% over 5 days reinforces that the trend is still rising, not just bouncing on a single session. COST is also near the top of its 3-month range, between 907.21 and 1,027.50, which tells investors the stock has already reclaimed a large part of its prior drawdown and is now working through overhead supply. That is why the nearest resistance matters more than the day’s gain itself.
The price is now only a short distance below resistance at 974.03, and the market is essentially asking whether this advance has enough force to keep going or whether it pauses beneath that level. A stock that trades near the top of its range with a rising moving-average structure is usually showing accumulation, but when it gets this close to resistance, the quality of the breakout matters more than the speed of the move.
Oscillators & Momentum
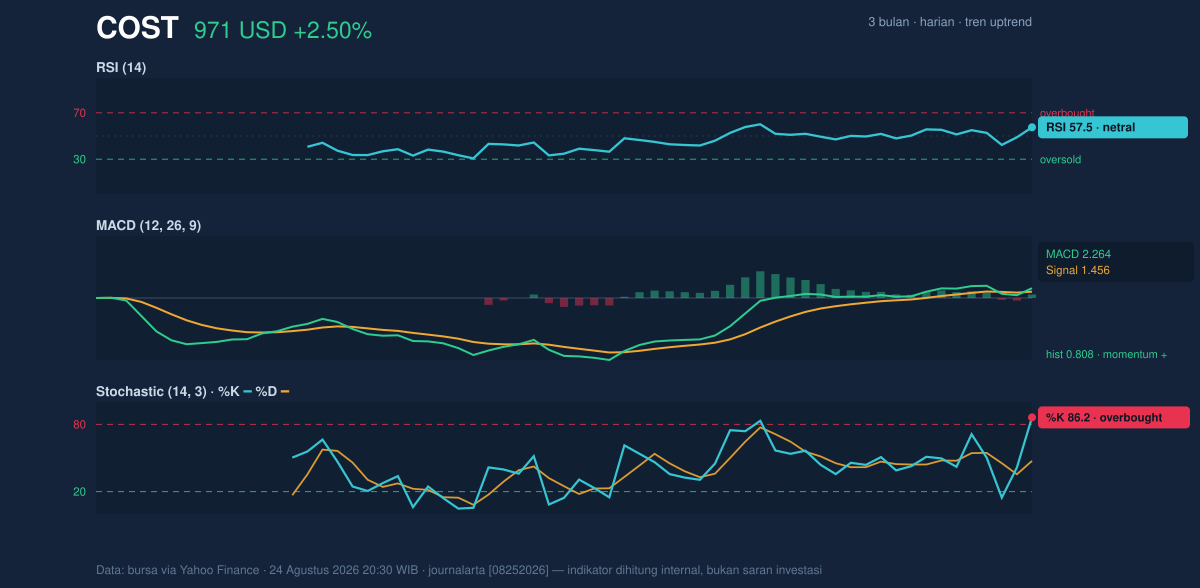
As shown in the chart, momentum is supportive but not perfectly synchronized. MACD at 2.264 sits above its signal line at 1.456, with a positive histogram of 0.808; that combination means upside momentum is still expanding, since the faster momentum line remains ahead of the slower one. Yet the oscillator mix is less clean than the trend picture: RSI at 57.5 is neutral, which suggests the stock is not yet in an extreme condition, while Stochastic %K at 86.2 versus %D at 47.4 points to a more overbought short-term posture. For general readers, stochastic measures where price sits inside its recent range; a high reading can mean the stock has run ahead of itself even if the broader trend remains intact.
That split is important. RSI says the move is not overheated in a broad sense, but stochastic says the latest push has moved quickly and may need to cool. In other words, the trend is constructive, but the stock is not starting from a fresh reset. That often leads to either a brief pause or a test of support before the next directional move.
Volatility & Volume
Bollinger Bands add another layer to the story. COST is trading near the upper band at 973.37, with %B at 95%, meaning the price sits very close to the top of its recent volatility envelope. The 4.0% band width is relatively tight and described in the data as a squeeze, which usually means the market has been compressing before a larger move. That compression can act like a spring: if buyers keep pressing, the stock can break upward with force; if they fade, the same tight structure can unwind quickly back toward the middle band at 954.08. The key point is that the current move is happening in a narrowed range, so the next decisive session may matter more than the last few incremental gains.
Volume offers some confirmation. The latest turnover of 2,204,700 shares was about 1.2x the 20-day average of 1,871,085, and OBV is rising. OBV, or on-balance volume, tracks whether volume is flowing in the direction of price. A rising OBV alongside a rising stock usually means the advance is being supported by participation, not just thin trading. ATR at 17.98, or 1.9% of price, suggests volatility is moderate rather than explosive, so the stock has room to move without being unusually erratic.
That combination is constructive. The move has participation, but not panic.
Key Levels & Scenarios
The most important support zone is clustered around 954.08 and 948.14, which line up with both the moving averages and the Bollinger middle band. Below that, 933.51 is the 20-hour support and also close to the lower Bollinger band at 934.80, making it the first clear line where a pullback would start to look more serious. On the upside, 974.03 is the immediate resistance to watch, and a sustained move through that area would put the upper range of the current structure back in play. Because the stock is already near the top of its daily range at 94%, the market is now more sensitive to whether it can convert this resistance into support.
If COST fails to clear 974.03, the most natural outcome is a rotation back toward the middle band and the moving-average cluster. If it breaks above that level with volume still above average, the squeeze structure suggests the next leg could extend more quickly than recent sessions have implied. If 933.51 gives way, the tone changes materially because that would place price below the short-term support shelf and near the lower band.
Technical Verdict: HOLD (wait & see)
HOLD (wait & see) fits the chart best because the trend is healthy, but momentum is mixed at the top of the range. Golden cross and price above SMA20/SMA50 are supportive, MACD is positive, and OBV is rising; however, Stochastic is overbought and price is pressing against 974.03 resistance with %B at 95%, so the stock is extended relative to its recent volatility band.
- Ideal Entry Range: 954.08 to 948.14, where the middle band and moving averages may act as support.
- Exit Target: 974.03 first, with the upper Bollinger band at 973.37 as the nearby technical ceiling.
- Stop Loss protection: 933.51, below the 20-hour support and near the lower Bollinger band at 934.80.
Verdict invalidated if price falls below 933.51. In plain English, COST looks strong, but it is close enough to resistance that the next move matters more than the current one.
2,204,700
Summary Data COST
| Last price | 971.40 USD |
| Change 1 day / 5 days / 1 month | 2.50% / 1.88% / 2.08% |
| Trend / MA-cross | uptrend / golden |
| SMA20 / SMA50 | 954.08 / 948.14 |
| RSI (14) / Stochastic %K | 57.5 / 86.2 |
| Bollinger %B / ATR | 95% / 17.98 |
| Support / Resistance 20 days | 933.51 / 974.03 |
| Data as of | 24 Agustus 2026 20:30 WIB |
Track COST stock price daily: live levels, support/resistance and our full COST analysis history.



