Testing Key Resistance, MELI Stock Gains 1.31% Today
On Agustus 25, 2026: price 1,947.90 USD, trend uptrend, RSI 61.1, support 1,779.14, resistance 1,947.90. technical analysis of meli stock.
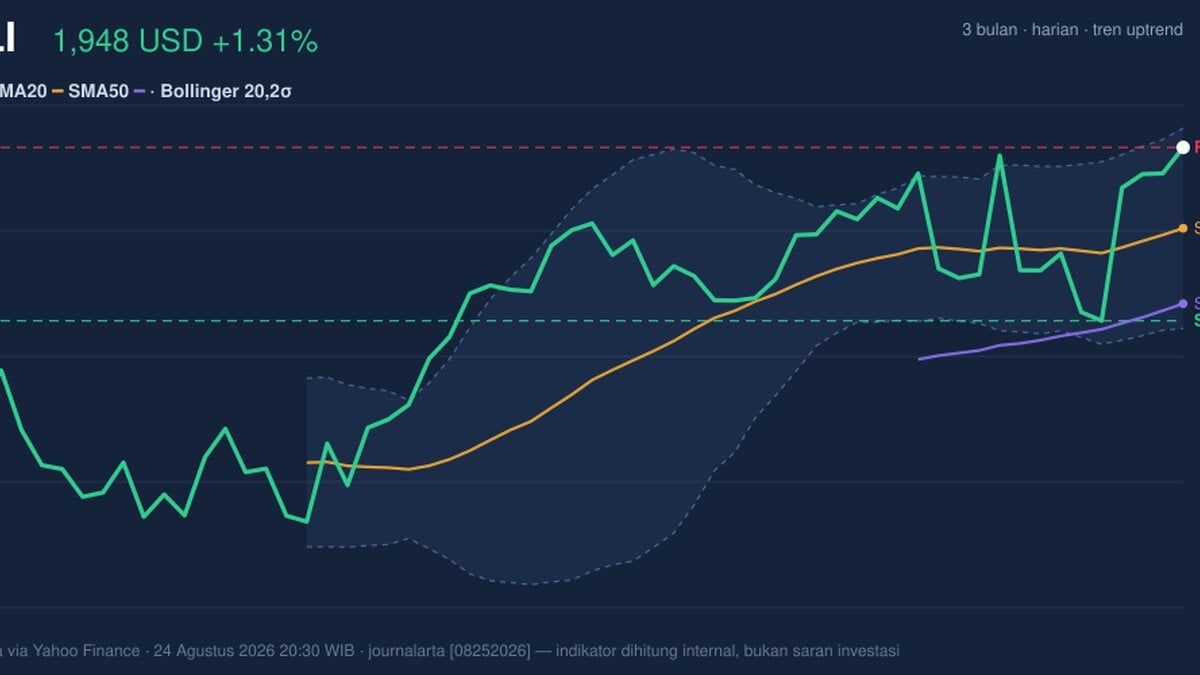
For international investors, MercadoLibre is trading near the top of its recent range, and the message from the chart is simple: momentum is still positive, but the stock is now close to a zone where strength can start to look stretched.
MercadoLibre (NASDAQ: MELI) last changed hands at 1,947.90 USD, up 1.31% on the day and 8.97% over 5 days, according to market data from Yahoo Finance. That places the stock just below its 3-month high of 1,990.99 and well above its 3-month low of 1,546.00, a range that shows the market has already re-rated the shares sharply in recent weeks. The key signal is not just that MELI is rising, but that it is doing so while remaining above both its SMA20 at 1,869.17 and SMA50 at 1,795.84, which keeps the broader trend pointed upward. In plain terms, the stock is still being bought on dips rather than sold on rallies.
Trend & Price Action
The price structure remains constructive. MELI is trading above the SMA20 and above the SMA50, and the SMA20 slope is up 1.19% over 5 days, which means short-term trend support is still rising rather than flattening out. There is no fresh MA-cross, so the bullish case is not being driven by a new moving-average crossover; instead, it is being sustained by price holding above both averages. That matters because it suggests the move is already established, not merely starting.
The stock is also pressing against the upper end of its Bollinger band structure. As shown in the chart, the upper Bollinger band sits at 1,966.71, only a little above the last price, while %B is 90%. That reading means price is trading near the top of its recent volatility envelope, a sign of strength but also of limited near-term room before the move starts to look overextended. The Bollinger band width of 10.4% is normal, so this is not a squeeze that usually precedes a sudden breakout; rather, it is a trend already in motion, with price pushing the envelope.
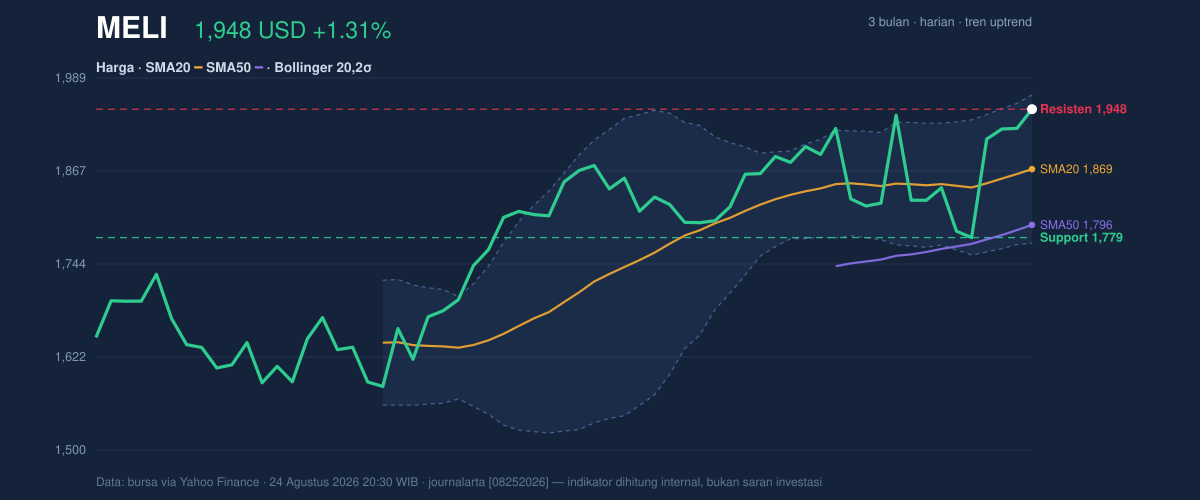
The short punchline: MELI is strong, but it is no longer cheap on the chart.
Oscillators & Momentum
Momentum indicators are split in a way that often appears late in an advance. The RSI at 61.1 is still neutral, which means the stock is not yet in classic overbought territory on that measure. But the Stochastic %K at 81.4 and %D at 83.0 are both overbought, showing that recent gains have been fast enough to push the stock into the upper part of its short-term range. In practical terms, Stochastic is warning that the pace of the rise has become stretched even if the broader trend has not broken.
The MACD picture remains supportive. The MACD at 26.848 is above the signal line at 21.543, with a positive histogram of 5.305. That combination indicates upward momentum is still dominating, and the histogram being positive means the gap between trend and signal remains in bullish territory. The important nuance is that MACD confirms trend direction, while Stochastic warns about timing. Together, they suggest MELI is trending higher, but short-term pullbacks could emerge before the next leg higher.
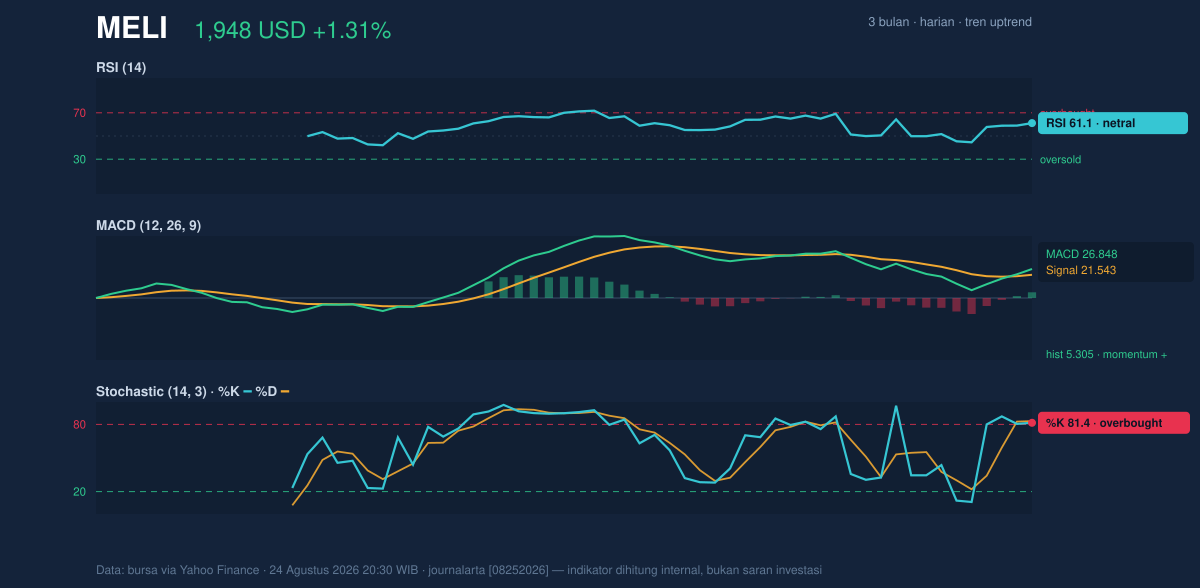
That is the classic “strong trend, tired short-term oscillator” setup.
Volatility & Volume
Volatility is elevated. The ATR(14) at 77.07, equal to 4.0% of price, means the stock can move materially in a single session, which raises the odds of sharp swings around nearby levels. This matters because MELI is now close to resistance, so a normal day’s range is large enough to test both breakout attempts and failure points.
Volume does not fully confirm the latest push. The most recent volume was 459,800, below the 20-day average of 496,385, or about 0.9x normal. That tells us the advance is not being powered by a dramatic surge in participation. Still, the OBV is rising, which is a constructive sign: on-balance volume tracks whether money flow is generally accumulating over time, and a rising OBV usually means buyers have been more persistent than sellers even if the latest session was not unusually active.
In other words, the chart is advancing, but it is doing so without a volume climax.
Key Levels & Scenarios
The immediate technical map is clear. The stock is sitting at the top of its 20-hour range at 1,947.90, with support at 1,779.14 and resistance effectively at the current price area, while the Bollinger ceiling at 1,966.71 is the next visible barrier. The fact that price is at 100% of the 20-hour range means there is little intraday cushion if momentum fades.
If MELI clears 1,966.71, the chart would be signaling a move into fresh range territory, with the 3-month high at 1,990.99 becoming the next obvious reference. If instead the stock fails to hold above 1,869.17, the SMA20 becomes the first important test of whether the rally is merely pausing or starting to lose traction. A deeper loss of 1,779.14 would weaken the current structure more meaningfully because it would break the listed 20-hour support and put the recent trend extension under pressure.
Technical Verdict: HOLD (wait & see)
HOLD (wait & see) fits the current setup because the trend is still positive, but short-term stretch is building.
- Reason 1: Price remains above the SMA20 and SMA50, and the MACD is positive, which keeps the broader trend intact.
- Reason 2: Stochastic is overbought and %B is 90%, showing the stock is trading near the top of its recent volatility band.
- Reason 3: Volume is below average even as OBV rises, so the advance is supported but not strongly confirmed by fresh trading activity.
- Invalidation: this verdict is invalidated if price falls below 1,779.14.
- Ideal Entry Range: 1,869.17 to 1,779.14
- Exit Target: 1,966.71 to 1,990.99
- Stop Loss protection: below 1,779.14
For non-traders, this means MELI is still in an uptrend, but the chart is close enough to resistance that patience matters more than chasing the move.
Summary Data MELI
| Last price | 1,947.90 USD |
| Change 1 day / 5 days / 1 month | 1.31% / 8.97% / 7.04% |
| Trend / MA-cross | uptrend / none |
| SMA20 / SMA50 | 1,869.17 / 1,795.84 |
| RSI (14) / Stochastic %K | 61.1 / 81.4 |
| Bollinger %B / ATR | 90% / 77.07 |
| Support / Resistance 20 days | 1,779.14 / 1,947.90 |
| Data as of | 24 Agustus 2026 20:30 WIB |
Track MELI stock price daily: live levels, support/resistance and our full MELI analysis history.



