Testing Key Resistance, Visa Stock Gains 3.06% Today
On Agustus 25, 2026: price 382.41 USD, trend uptrend, RSI 69.2, support 358.84, resistance 382.41. technical analysis of visa stock. Testing Key Resistance —…
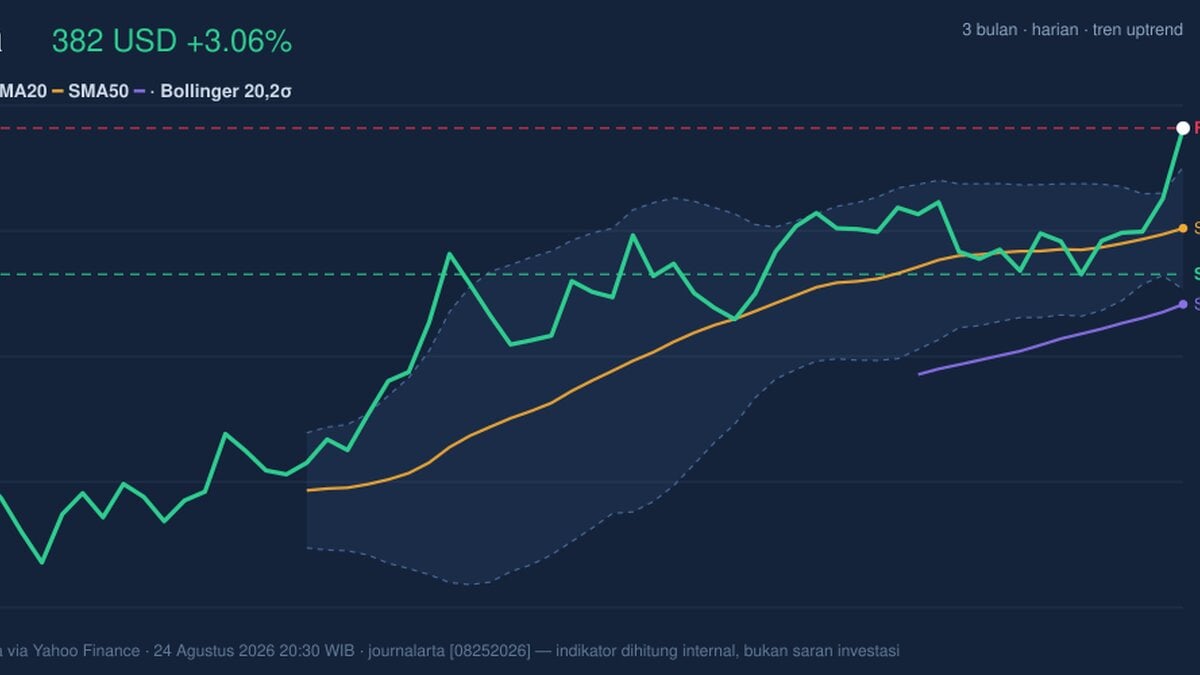
Visa advanced to 382.41 USD on NYSE, up from a previous close of 371.04, as the payments giant pushed back to the top of its recent range and pressed against a fresh resistance area, according to market data from Yahoo Finance. The move matters less as a single-day gain than as a signal: the stock is now trading with momentum, but also with less room for error after a steady climb that has left it stretched near the upper edge of its chart.
Trend & Price Action
The broader setup still points upward. Visa is above both its SMA20 at 366.27 and SMA50 at 354.02, which tells traders the stock is not merely bouncing, but holding above its short- and medium-term trend lines. The SMA20 slope of 0.96% over 5 days reinforces that the trend is rising rather than flattening out.
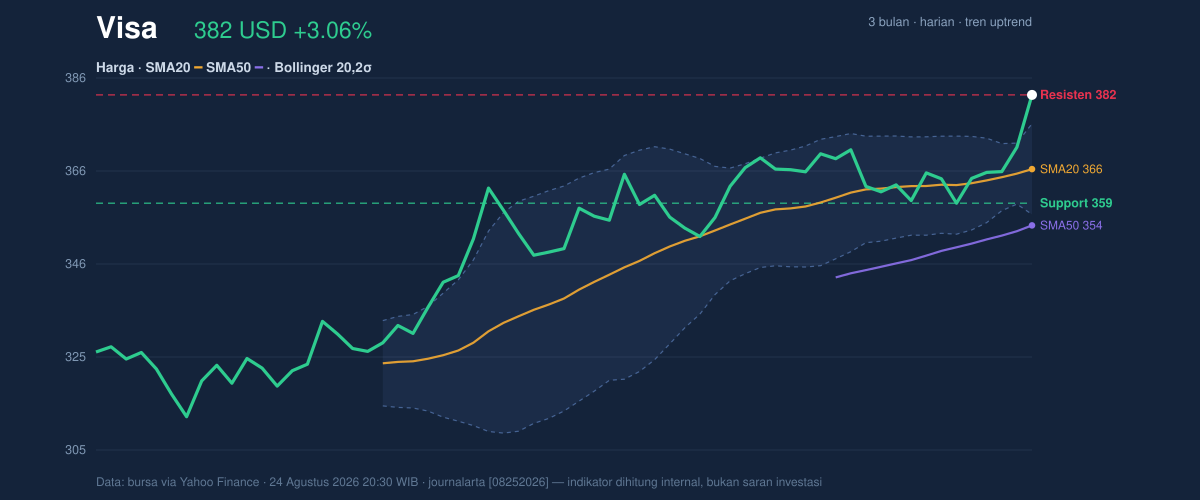
What stands out in the chart is how completely price has occupied the upper end of its recent band. The stock is at 100% of its 20-hour range, sitting on resistance at 382.41 and just below the 3-month high of 383.43. That positioning is powerful, but it also means the market is no longer pricing in much immediate upside without a clean breakout. When a stock sits this close to a high after a multi-day advance, the next move often depends on whether buyers can keep showing up rather than whether the trend still looks healthy on paper.
The Bollinger structure adds to that message. Price is above the upper band at 376.14, and %B at 132% shows the stock is trading beyond the usual envelope of the 20-day range. That does not automatically mean reversal; it means the market is running hot relative to its recent average. The 5.4% Bollinger width is also narrow, which suggests a squeeze. In plain terms, the chart is compressed beneath the surface, and compressed charts often lead to sharper moves once they resolve.
Oscillators & Momentum
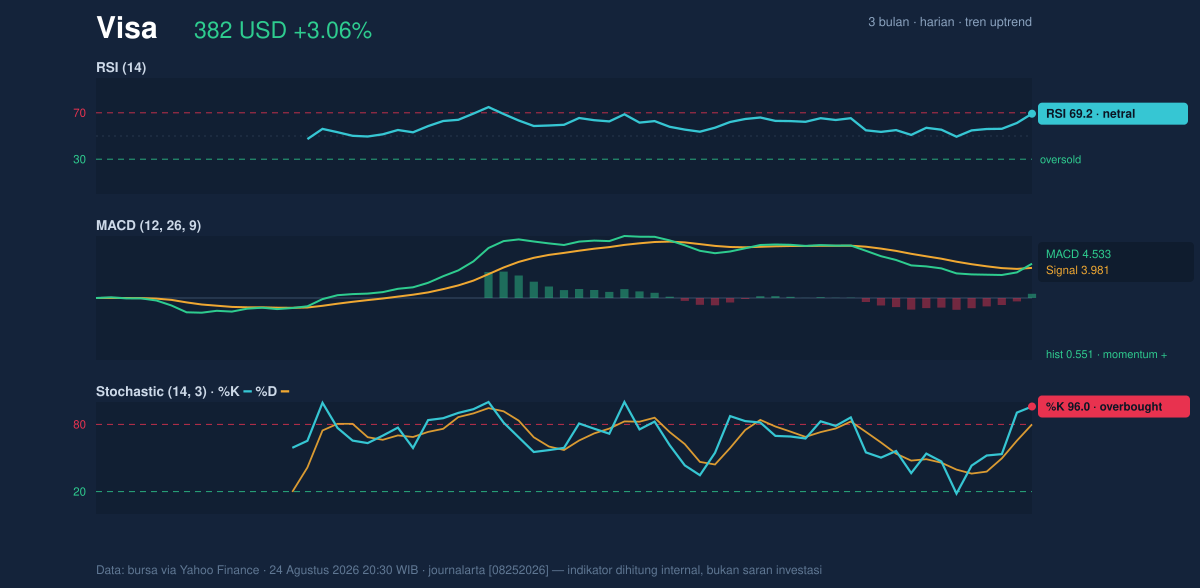
The momentum picture is supportive, but not cleanly balanced. The RSI at 69.2 sits just below the classic overbought threshold, which signals strength without yet confirming exhaustion. That distinction matters: RSI near 70 often means buyers remain in control, but the market is close enough to a crowded condition that follow-through becomes harder to sustain.
The Stochastic %K at 96.0 and %D at 80.0 are more stretched. Stochastic is a faster oscillator, so it tends to flash earlier when price has moved too far too fast. Here, it says the stock is trading near the top of its recent momentum band, which can be a sign of continuation in a strong trend, but also a warning that short-term pullbacks become more likely if momentum cools.
The MACD at 4.533, above its signal line at 3.981, with a positive histogram of 0.551, confirms momentum is still aligned with the trend. In practical terms, MACD is saying the recent advance is not just a one-day spike; the trend has enough internal force to keep pushing higher. That is important because when MACD, price, and moving averages all point the same way, the market is usually still in expansion mode rather than distribution.
Volatility & Volume
Visa’s ATR(14) of 6.51, equal to 1.7% of price, suggests volatility is moderate rather than extreme. That matters because a stock can be technically strong without being chaotic; here, the move has room to breathe, but not enough to imply a disorderly breakout environment.
Volume also supports the move. The latest volume of 8,477,500 shares is about 1.1× normal versus the 20-day average of 7,467,675, and OBV is rising. OBV, or on-balance volume, tracks whether volume is flowing into the stock on up days. A rising OBV alongside a rising price generally means the advance is being confirmed by participation, not simply by thin trading. That is a healthier signal than a price rise on weak turnover.
Key Levels & Scenarios
The key support line is 358.84. If price holds above that area, the trend remains structurally intact and the recent breakout attempt can keep building. If it slips below that level, the market would be signaling that the latest push has lost traction and that the move back toward the moving averages is no longer just a shallow pause.
On the upside, 382.41 is now the immediate resistance, with the 3-month high at 383.43 just above it. That narrow gap is important: a move through both levels would mark a fresh high and likely confirm that the squeeze has resolved in favor of buyers. If price fails to clear that zone, the stock may spend time consolidating just beneath resistance while momentum resets.
The current setup is therefore not about whether Visa is strong; it is about whether strength can convert into a decisive break or stalls into a brief pause.
Technical Verdict: HOLD (wait & see)
HOLD (wait & see)
- MACD is positive and above signal, which supports the trend.
- Price is above SMA20 and SMA50, confirming the broader structure remains constructive.
- Stochastic is overbought and price is already at resistance / the 3-month high zone, so the near-term setup is extended.
Verdict invalidated if price breaks below 358.84.
- Ideal Entry Range: 366.27 to 376.14
- Exit Target: 383.43
- Stop Loss protection: 358.84
For non-traders, that means Visa still looks technically strong, but the chart is already stretched enough that the next move needs confirmation rather than assumption.
“The market is asking whether this is a breakout or just a pause at the summit.”
Summary Data Visa
| Last price | 382.41 USD |
| Change 1 day / 5 days / 1 month | 3.06% / 6.57% / 5.48% |
| Trend / MA-cross | uptrend / none |
| SMA20 / SMA50 | 366.27 / 354.02 |
| RSI (14) / Stochastic %K | 69.2 / 96.0 |
| Bollinger %B / ATR | 132% / 6.51 |
| Support / Resistance 20 days | 358.84 / 382.41 |
| Data as of | 24 Agustus 2026 20:30 WIB |
Track Visa stock price daily: live levels, support/resistance and our full Visa analysis history.



