WMT Stock Analysis: Gains 2.69%, Momentum Weakens
On Agustus 25, 2026: price 106.49 USD, trend sideways, RSI 38.0, support 103.70, resistance 116.01. technical analysis of wmt stock. WMT Stock Analysis — full…
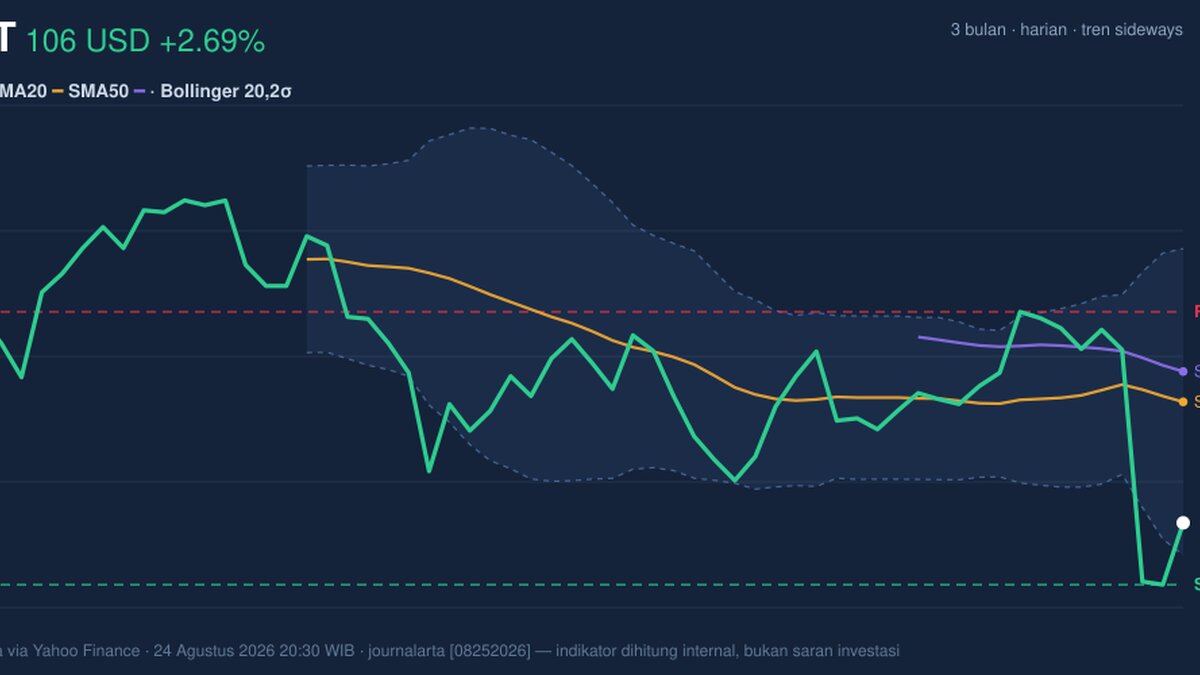
Walmart is holding above its recent low, but the chart still says the market is pricing in caution rather than conviction. The shares last traded at 106.49 USD on the NYSE, up 2.69% on the day, yet still below the key short- and medium-term averages that usually anchor trend direction.
Trend & Price Action
As shown in the chart, WMT remains in a sideways trend, but it is trading below SMA20 at 111.95 and below SMA50 at 113.32. That matters because when price sits under both moving averages, rallies often face overhead supply from investors who bought higher and are waiting to exit near breakeven. The absence of a new MA-cross means there is no fresh trend reversal signal yet; the market is still waiting for price to prove that the recent weakness has ended.
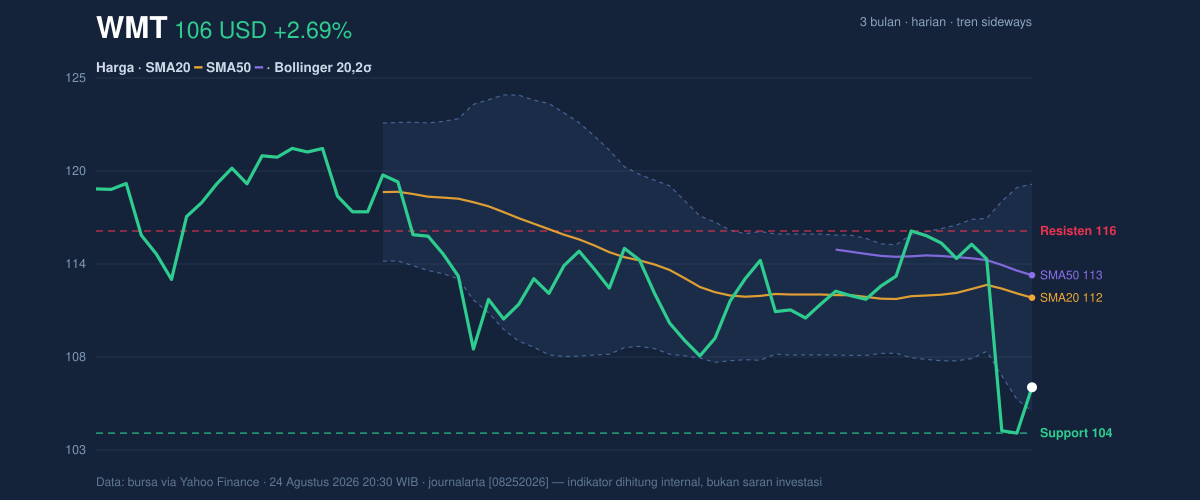
The stock is also positioned near the lower end of its recent range: the 20-hour support at 103.70 and the 3-month low at 102.15 sit close beneath current trading, while the 20-hour resistance at 116.01 and the 3-month high at 122.94 remain well above. In practical terms, WMT is not in free fall, but it is still trading in the lower part of the corridor, where buyers need to defend nearby support before any broader recovery can be trusted.
The Bollinger Band setup reinforces that picture. With price at %B 11%, the shares are hugging the lower band, which often signals that the stock is stretched to the downside in the short term. But the band width is only 12.4%, described here as normal, so this is not a volatility breakout regime; it is more a compressed, indecisive market than a dramatic trend expansion. The lower band at 105.03 is especially important because price is trading just above it, making that area a near-term line of defense.
Oscillators & Momentum
The momentum tools are mixed, but not in a bullish way. The RSI at 38.0 is still in neutral territory, though it sits below the midpoint that would usually suggest balanced demand. That means the stock is weak, but not yet technically oversold. The Stochastic %K at 29.5 and %D at 15.7 show short-term momentum near the lower end of the scale, which can hint at a rebound attempt, yet the signal is not strong enough to call a clean reversal on its own.
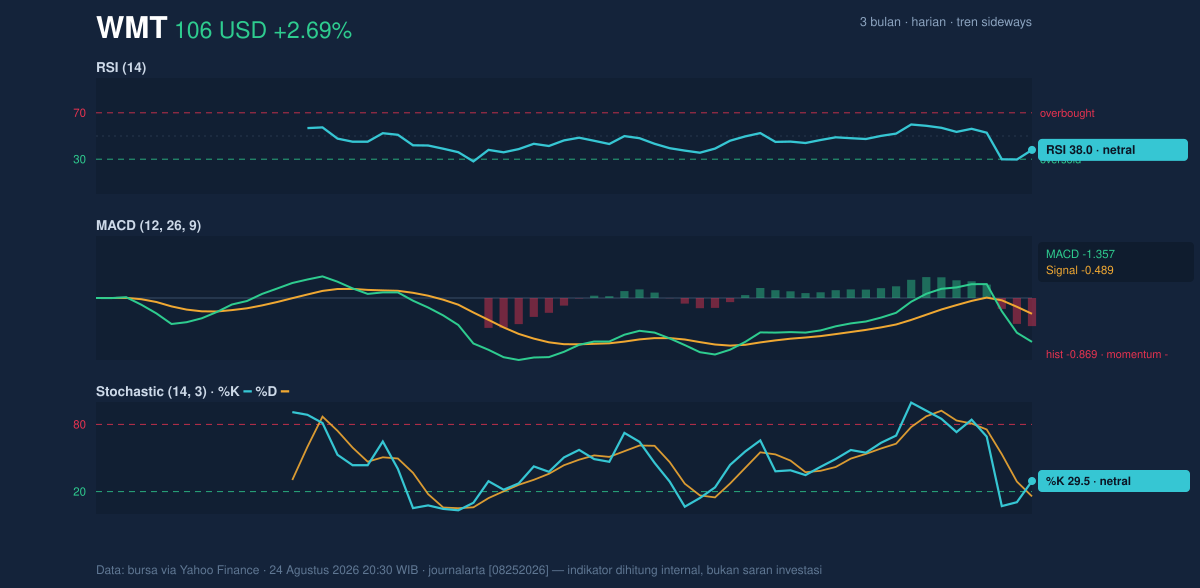
The more decisive message comes from MACD. With MACD at -1.357, the signal line at -0.489, and the histogram at -0.869, momentum remains negative. In plain language, the recent price action is still moving faster to the downside than the upside, even if the decline has slowed enough to keep the stock from looking deeply oversold. That combination — neutral RSI, low Stochastic, but negative MACD — usually means the stock is trying to stabilize, not yet reversing with force.
Volatility & Volume
Volatility is present, but not extreme. The ATR at 2.86, or 2.7% of price, suggests the stock can still move meaningfully in either direction over a short period, but not in a disorderly way. That matters because a move above resistance or below support can travel quickly once triggered. The current 1.3× normal volume is also important: trading activity was heavier than average, which means the day’s move was not just a thinly traded bounce. Still, the OBV is down, and that is a caution flag. On-balance volume tracks whether money flow is generally accumulating or leaving the stock; a falling OBV implies that, despite the recent uptick, broader participation has not yet shifted firmly in favor of buyers.
The signal from volume is therefore mixed rather than confirming. Elevated turnover can mark the start of a turn, but when OBV continues to drift lower, rallies are more likely to be treated as tactical rebounds unless price can reclaim the moving averages and hold them.
Key Levels & Scenarios
The chart shows a market that is trapped between nearby support and overhead resistance. 103.70 is the first level that matters on the downside, because it is both the 20-hour support and close to the lower Bollinger band. If that floor gives way, the next reference point is the 3-month low at 102.15, which would confirm that the stock is still making lower ground rather than building a base.
On the upside, 111.95 is the first reclaim level to watch because it is the SMA20 and the Bollinger midpoint. A move back above that line would say the stock is recovering its short-term balance. Above that, 113.32 becomes the next hurdle, since the SMA50 often acts as a heavier resistance zone in a sideways market. Beyond that, 116.01 is the near-term ceiling that would need to break for the chart to shift from stabilization to a more constructive structure.
The core message is that WMT is stabilizing, but momentum and trend confirmation are still missing. The stock is close enough to support for a rebound, yet still below the averages and with MACD negative, so the burden remains on buyers to prove that the recent pressure is fading.
Technical Verdict: HOLD (wait & see)
HOLD (wait & see)
- MACD is still negative, which says downside momentum has not fully cleared.
- Price remains below SMA20 at 111.95 and SMA50 at 113.32, so the trend has not been reclaimed.
- %B at 11% shows the stock is near the lower Bollinger band, which can support a bounce, but not yet a confirmed reversal.
Verdict invalidated if price falls below 103.70, because that would break the nearest support and expose the 102.15 low.
- Ideal Entry Range: 103.70 to 105.03
- Exit Target: 111.95 to 113.32
- Stop Loss protection: below 103.70, with the next reference at 102.15
For non-traders, this means the chart is not broken, but it has not turned healthy enough to call the move finished.
Summary Data WMT
| Last price | 106.49 USD |
| Change 1 day / 5 days / 1 month | 2.69% / -6.86% / -4.70% |
| Trend / MA-cross | sideways / none |
| SMA20 / SMA50 | 111.95 / 113.32 |
| RSI (14) / Stochastic %K | 38.0 / 29.5 |
| Bollinger %B / ATR | 11% / 2.86 |
| Support / Resistance 20 days | 103.70 / 116.01 |
| Data as of | 24 Agustus 2026 20:30 WIB |
Track WMT stock price daily: live levels, support/resistance and our full WMT analysis history.



