AIA Stock Drops 1.06% Today, Momentum Gains
On Agustus 26, 2026: price 74.35 HKD, trend sideways, RSI 49.4, support 70.40, resistance 79.65. technical analysis of aia stock. AIA Stock Drops — full…
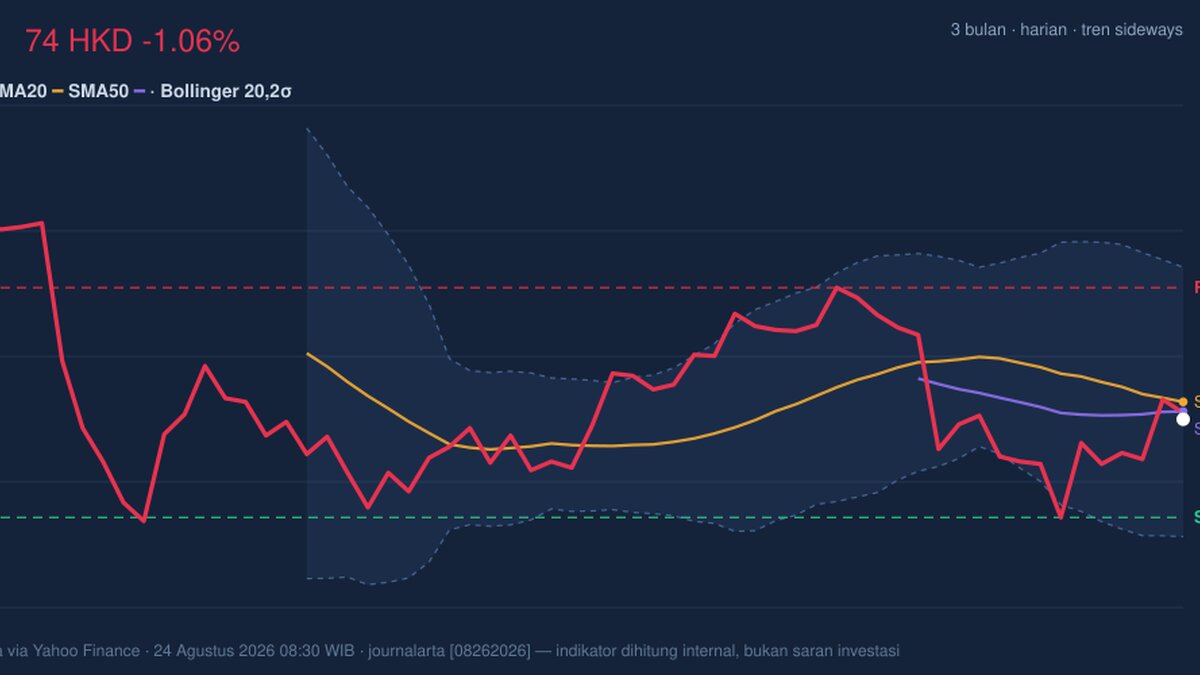
At 74.35 HKD, AIA Group is trading just below its short-term average and inside a broad sideways band, with the latest move showing a 1-day decline of 1.06% even as the stock remains 1.29% higher over 5 days. That combination matters: it signals a market that has not lost interest, but also has not committed to a clear direction. The share price is sitting below the SMA20 at 75.05 and only slightly above the SMA50 at 74.67, which is the kind of setup that often reflects hesitation rather than trend strength.
Trend & Price Action
The chart shows a stock that is still boxed into a range, not trending cleanly. The sideways trend is reinforced by the SMA20 slope of -1.34% over 5 days, which tells readers the recent short-term bias has tilted lower, even if only modestly. Price is also positioned at 43% of the 20-hour range, meaning it is closer to the lower half than the upper half, but not yet pressing into a breakdown zone. That placement is important because it suggests sellers have had the upper hand recently, yet not enough to force a decisive move below support.
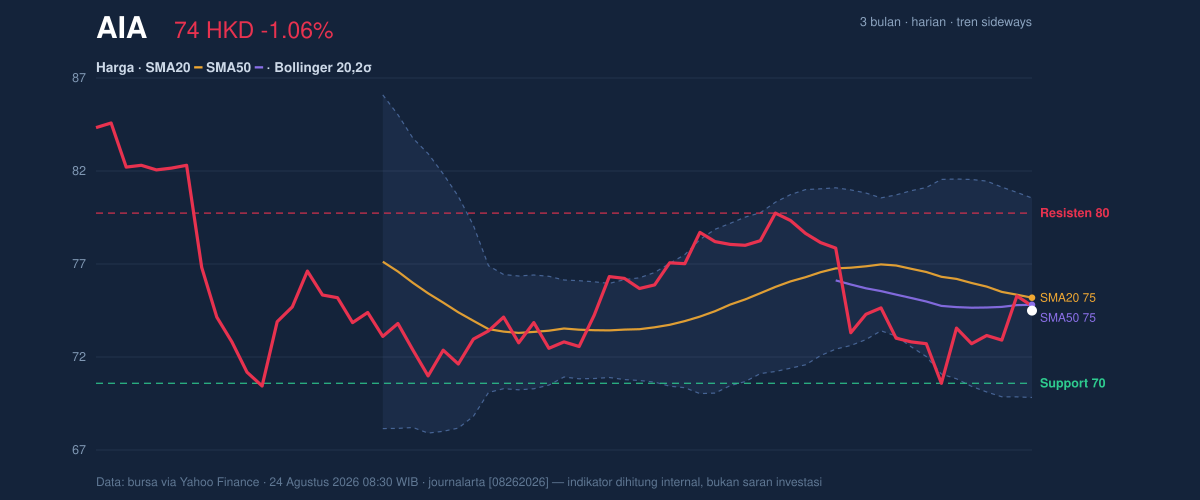
The Bollinger Bands add another layer of context. With the middle band at 75.05, the stock is trading slightly under the mean of the recent range, while the lower band at 69.63 and upper band at 80.47 frame the likely boundaries of near-term trade. The %B reading of 44% says the price is below the midpoint of the band structure, but not stretched to the downside. In plain language, AIA is not oversold; it is simply leaning weak within a normal volatility regime. The 14.4% Bollinger width confirms that the market is not in a squeeze or expansion phase, so a sharp breakout is not being signaled by volatility alone.
Oscillators & Momentum
The momentum picture is more balanced than the price action. The RSI at 49.4 is almost perfectly neutral, which means the stock is neither overbought nor oversold. The Stochastic %K at 56.1 and %D at 44.3 also sit in neutral territory, but the spread between them suggests short-term momentum has improved enough to avoid immediate downside exhaustion. This matters because a neutral oscillator reading after weakness often indicates consolidation rather than trend reversal.
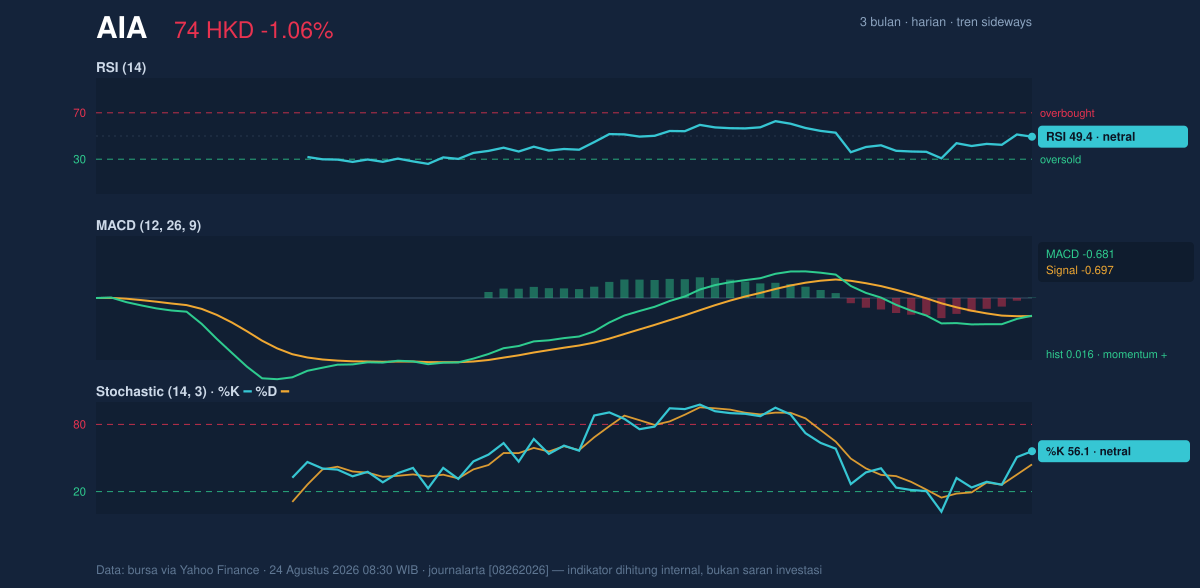
The more interesting signal comes from MACD. The MACD at -0.681 remains below zero, which usually points to a still-cautious trend backdrop, but the signal line at -0.697 is slightly lower, leaving a positive histogram of 0.016. That small positive reading means downside momentum is easing. It is not a bullish breakout signal, but it does show that the stock’s recent weakness is losing force. Combined with the neutral RSI, this looks more like a pause in pressure than a fresh downtrend acceleration.
Volatility & Volume
Volatility is present, but not extreme. The ATR(14) of 2.34, equal to 3.1% of price, tells us the stock can still move enough in a day to matter, yet the market is not behaving erratically. That is consistent with a range-bound name where traders can still test support and resistance without a major volatility shock.
Volume is the most mixed part of the setup. Last session turnover reached 58,041,195, or 1.8 times the 20-day average of 32,919,704. On its own, that is a strong participation signal. But the OBV is falling, which weakens the message. OBV, or on-balance volume, tracks whether volume is flowing into the stock or out of it over time. A rising daily volume spike with a falling OBV often means distribution: active trading, but not necessarily accumulation. In this case, the chart suggests the market is engaged, yet not clearly buying the dip.
Key Levels & Scenarios
The nearest technical map is straightforward. The 20-hour support at 70.40 is the first level that would matter if selling resumes, while the 20-hour resistance at 79.65 is the first ceiling that would need to be cleared for a stronger recovery attempt. The broader range matters too: the 3-month low at 69.05 sits just below current support, while the 3-month high at 86.00 marks the upper boundary of the recent trading history. That wider frame says the stock is not near a historic extreme, but it is much closer to the lower half of its recent band than the upper half.
If price holds above 74.67 and starts to reclaim 75.05, the market would be signaling that the short-term drift is stabilizing. If it then pushes through 79.65, the chart would begin to repair more meaningfully. If instead it falls below 70.40, the technical tone would shift toward a deeper test of the 69.63 Bollinger lower band and the 69.05 three-month low. That would indicate the current sideways structure has failed on the downside.
Technical Verdict: HOLD (wait & see)
HOLD (wait & see) is the clearest read from the chart because the stock is caught between neutral momentum and a slightly soft short-term trend. The RSI at 49.4 and Stochastic at 56.1/44.3 do not confirm a strong directional edge. The MACD histogram at 0.016 is improving, but only modestly, while the price remains below the SMA20 at 75.05. Volume is supportive in size, yet the falling OBV warns that participation has not translated into convincing accumulation.
- Ideal Entry Range: 74.67 to 75.05, where the stock sits near the SMA50 and the Bollinger middle band.
- Exit Target: 79.65, the 20-hour resistance; a stronger technical stretch would be toward 80.47, the upper Bollinger band.
- Stop Loss protection: 70.40, the 20-hour support; a break below 69.63 would weaken the range structure further.
- Verdict invalidated if price breaks below 70.40.
For non-traders, this means the chart is not showing a clear winner between buyers and sellers yet, and the stock is still waiting for a more decisive move.
The latest 3-month low stands at 69.05.
Summary Data AIA
| Last price | 74.35 HKD |
| Change 1 day / 5 days / 1 month | -1.06% / 1.29% / -4.62% |
| Trend / MA-cross | sideways / none |
| SMA20 / SMA50 | 75.05 / 74.67 |
| RSI (14) / Stochastic %K | 49.4 / 56.1 |
| Bollinger %B / ATR | 44% / 2.34 |
| Support / Resistance 20 days | 70.40 / 79.65 |
| Data as of | 24 Agustus 2026 08:30 WIB |
Track AIA share price daily: live levels, support/resistance and our full AIA analysis history.



