Alibaba Stock Drops 7.15%, Momentum Weakens In Focus
On Agustus 26, 2026: price 114.20 HKD, trend sideways, RSI 41.4, support 111.80, resistance 128.10. technical analysis of alibaba stock.
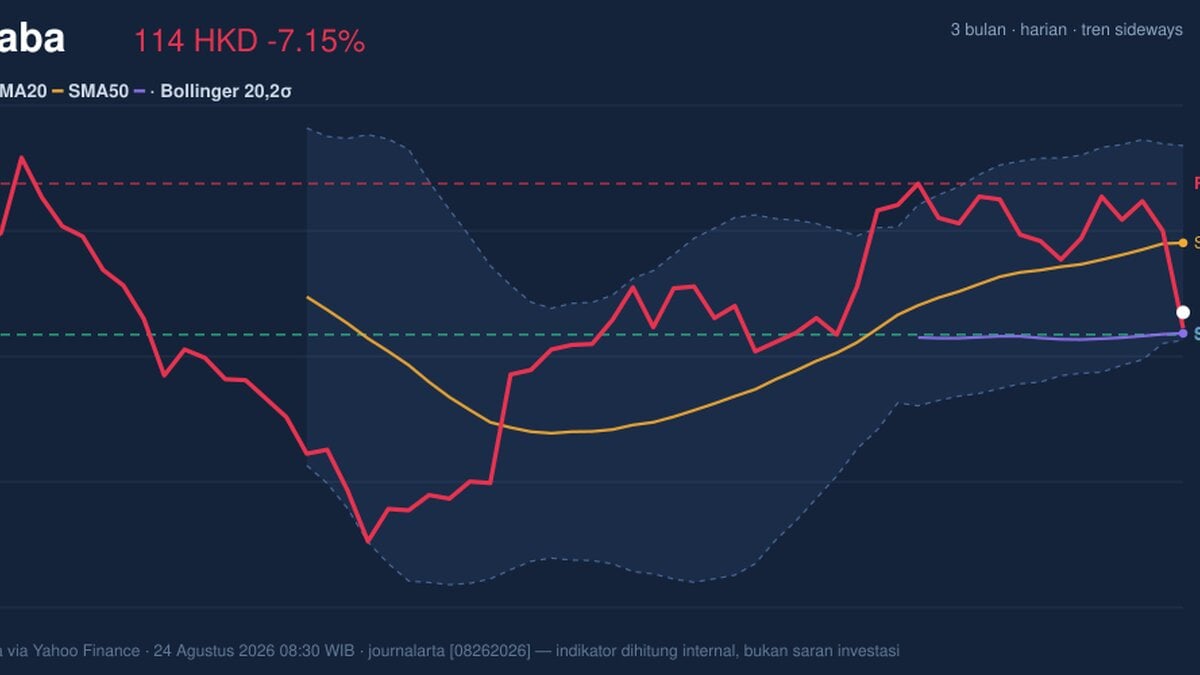
Alibaba Group’s Hong Kong-listed shares fell to HKD 114.20 on 24 August 2026, sliding 7.15% in a day as the stock slipped below its SMA20 at 121.70 while still holding above its SMA50 at 111.95, a setup that points to a market that is neither in a clean uptrend nor a full breakdown. The move matters because it shows traders have started to fade recent strength: the price is now sitting well under the short-term average, but not yet below the longer trend line that often acts as a last technical floor. That leaves Alibaba in a fragile middle zone, where sentiment can turn quickly if support gives way.
Trend & Price Action
As shown in the chart, Alibaba is still described as sideways, but the positioning is weakening: the share price is below the SMA20 and the short-term slope of the moving average is only 1.93% over 5 days, which suggests recent buying pressure has cooled rather than accelerated. There is no fresh MA cross, so the chart is not giving a new trend signal yet. In plain terms, that means the market has not confirmed a decisive change in direction; it is pausing, but with a downward bias in the near term.
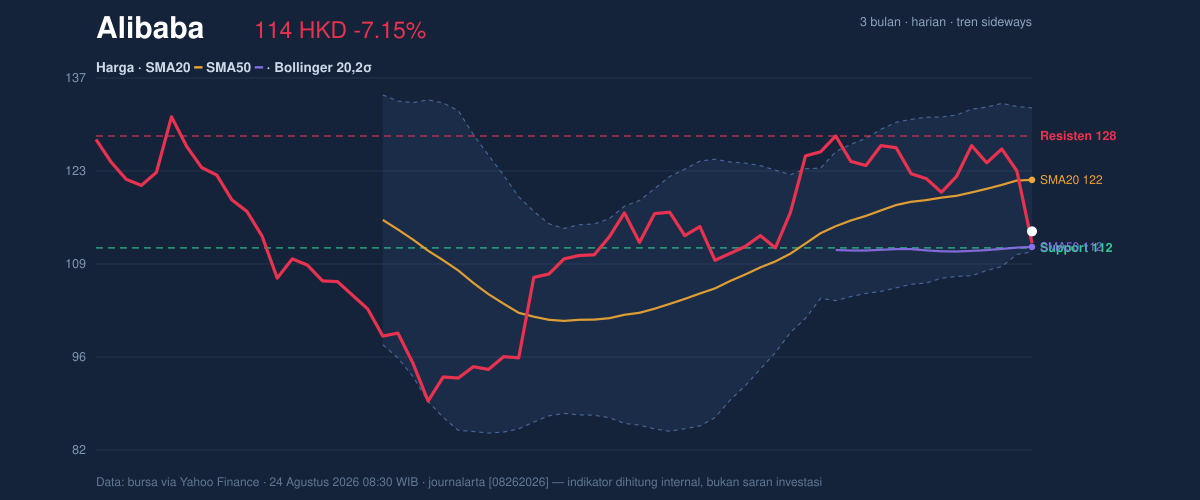
The stock is also trading near the lower half of its recent range. With a 20-day support at 111.80 and 20-day resistance at 128.10, the last price sits closer to support than resistance, but not close enough to call it a rebound. The share is also below the midpoint of the 3-month high/low range of 131.20 and 88.65, which tells readers the market has recovered from the lows, yet has not earned enough momentum to challenge the upper band again. A 1-month gain of 2.88% now looks modest against the sharp 5-day drop of 6.55%.
A weak bounce can still be a weak market.
Oscillators & Momentum
The momentum picture is mixed, and that mix is important. The RSI at 41.4 is neutral, meaning the stock is not technically overbought or oversold on that measure. But the Stochastic %K at 11.9 versus %D at 38.4 shows the shares are in oversold territory, which often means selling has become stretched in the short run. That does not guarantee a reversal; it simply signals price has fallen faster than the broader trend can comfortably absorb. The MACD at 2.013 remains below its signal line at 3.120, with a histogram of -1.106, a classic sign that downside momentum is still in control. In other words, the stock may be oversold, but the trend-following indicator has not yet turned up to confirm a recovery.
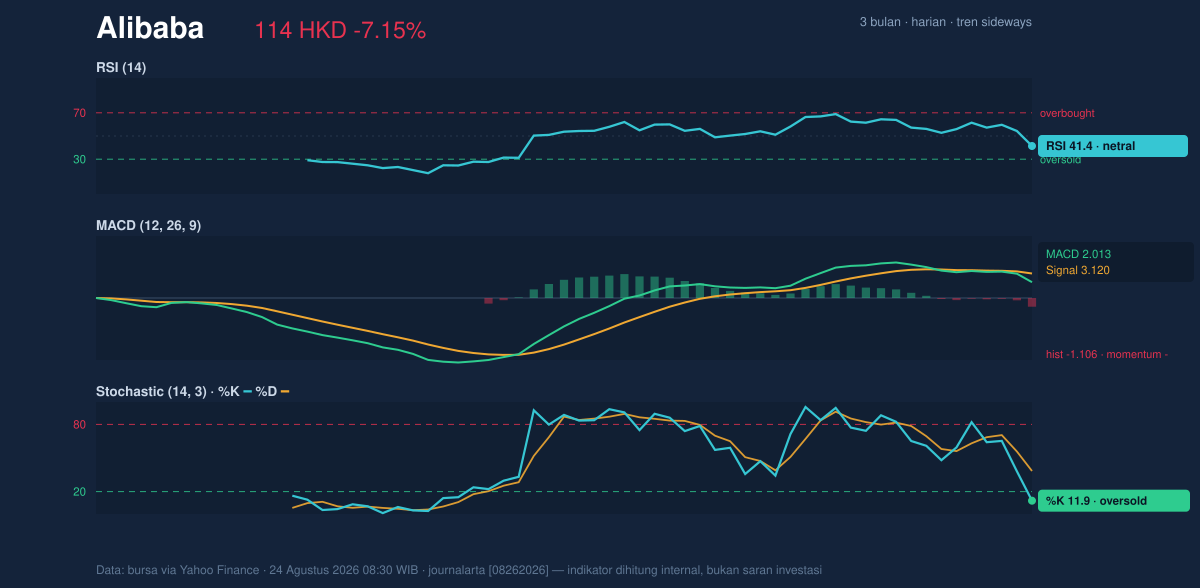
This combination is usually the most important nuance in a chart like this: oversold oscillators can hint at a bounce, but negative MACD tells us the bounce, if it comes, is happening inside a still-soft momentum backdrop. That is why traders tend to wait for confirmation rather than assume the first rebound is durable.
Volatility & Volume
Volatility is elevated. The ATR(14) at 5.14, equal to 4.5% of price, means the stock is capable of moving sharply in either direction over a short period. The Bollinger Bands add another layer: price is near the lower band at 111.20, with %B at 14% and a normal band width of 17.2%. That combination says the stock is trading close to the lower edge of its recent statistical range, but not in a volatility squeeze that would usually precede a breakout. Instead, the market is already active, and the question is whether that activity turns into stabilization or further selling.
Volume is the clearest sign that this move is being taken seriously. Last volume reached 362,953,456, about 3.5× the 20-day average of 103,708,869. Heavy turnover during a decline often means institutions and larger investors are participating, not just retail noise. Yet the OBV is down, which suggests the larger flow of money has not been accumulating shares on balance. That is a caution flag: high volume alone is not bullish if the cumulative volume trend is still falling.
The market is active, but not yet constructive.
Key Levels & Scenarios
The most important level on the chart is 111.80 support, which is only slightly above the Bollinger lower band at 111.20 and just over the SMA50 at 111.95. That clustering makes the area technically significant: if it holds, the stock has a chance to stabilize around a zone where multiple indicators converge. If it fails, there is little nearby structure before the chart opens toward the lower part of the 3-month range at 88.65. On the upside, 128.10 resistance is the first meaningful ceiling, with the Bollinger upper band at 132.20 and the 3-month high at 131.20 reinforcing that region as a tougher barrier.
The current price is sitting at about 15% of the 20-day range from support to resistance, which means it is still much closer to the floor than the ceiling. That positioning is important because it shows the market has not yet repaired the damage from the recent drop; it is still testing whether the lower band of support can absorb supply.
Technical Verdict: HOLD (wait & see)
HOLD (wait & see) is the clearest reading from the chart because the stock is below SMA20, MACD is negative, and volume is heavy but OBV is falling, while Stochastic is oversold and price remains above SMA50.
- Reason 1: The price is below SMA20 at 121.70, which shows short-term weakness.
- Reason 2: MACD 2.013 below signal 3.120 with a -1.106 histogram confirms negative momentum.
- Reason 3: Stochastic %K 11.9 signals oversold conditions, but OBV is down, so participation has not yet turned constructive.
- Verdict invalidated if price breaks below 111.80, because that would mean support, the lower Bollinger area, and the SMA50 cluster are all failing together.
- Ideal Entry Range: 111.80 to 114.20
- Exit Target: 121.70 to 128.10
- Stop Loss protection: below 111.20
For non-traders, this means the chart is close to support, but it has not yet proved that the selling pressure is over.
Last price: HKD 114.20.
Summary Data Alibaba
| Last price | 114.20 HKD |
| Change 1 day / 5 days / 1 month | -7.15% / -6.55% / 2.88% |
| Trend / MA-cross | sideways / none |
| SMA20 / SMA50 | 121.70 / 111.95 |
| RSI (14) / Stochastic %K | 41.4 / 11.9 |
| Bollinger %B / ATR | 14% / 5.14 |
| Support / Resistance 20 days | 111.80 / 128.10 |
| Data as of | 24 Agustus 2026 08:30 WIB |
Track Alibaba share price daily: live levels, support/resistance and our full Alibaba analysis history.



