AMD Momentum Weakens: Stock Gains 4.91% (Agustus 26, 2026)
On Agustus 26, 2026: price 479.18 USD, trend downtrend, RSI 47.7, support 429.56, resistance 518.58. technical analysis of amd stock. AMD Momentum Weakens —…
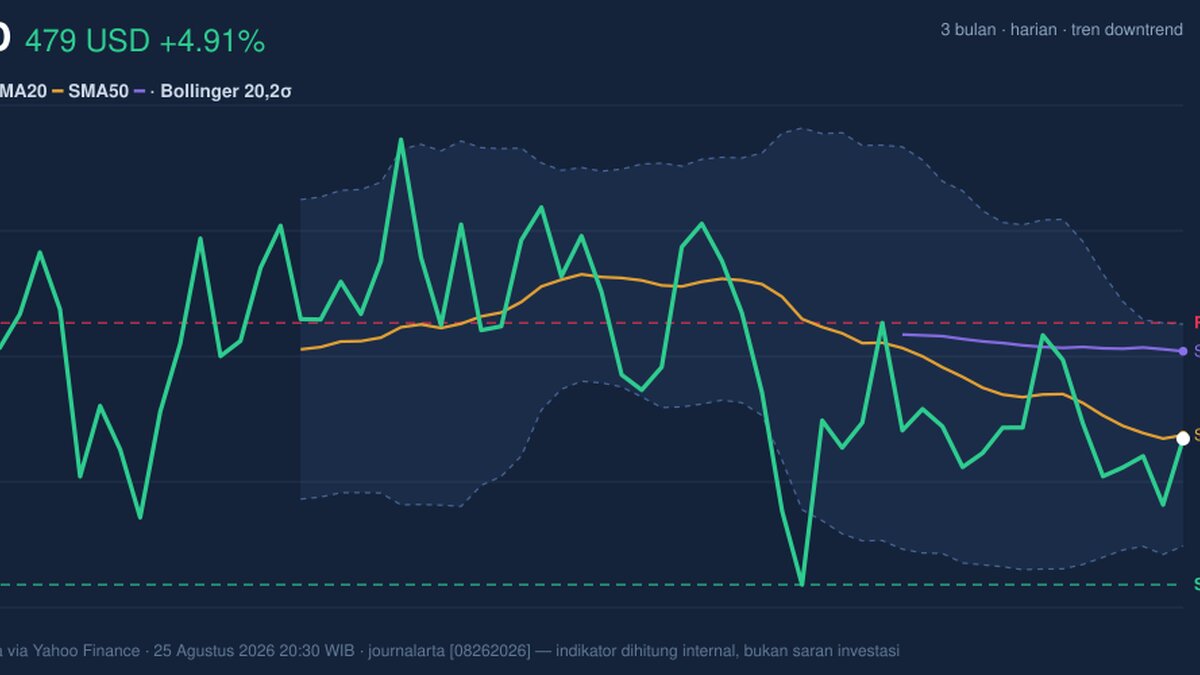
AMD is trading in the middle of a wide range, but the signal mix still leans cautious: the shares bounced on the day, yet the broader tape has not fully repaired the recent downtrend.
Advanced Micro Devices closed at 479.18 USD, up 4.91% from the prior close of 456.75 USD, according to data compiled from Yahoo Finance. That rebound matters, but it does not by itself change the larger picture. The stock remains below its SMA20 at 480.43 and well under the SMA50 at 508.95, which tells traders the price is still operating beneath both the short-term and medium-term trend markers. In plain terms, the bounce is real, but the trend has not yet flipped.
Trend & Price Action
The chart shows AMD sitting just under the 20-day average, with the SMA20 sloping down 2.22% over 5 days. That slope is important because it signals that recent rallies have not yet been strong enough to reverse the selling pressure that built earlier. There is also no fresh MA-cross, so the market is missing the kind of moving-average confirmation that often accompanies a more durable trend change.
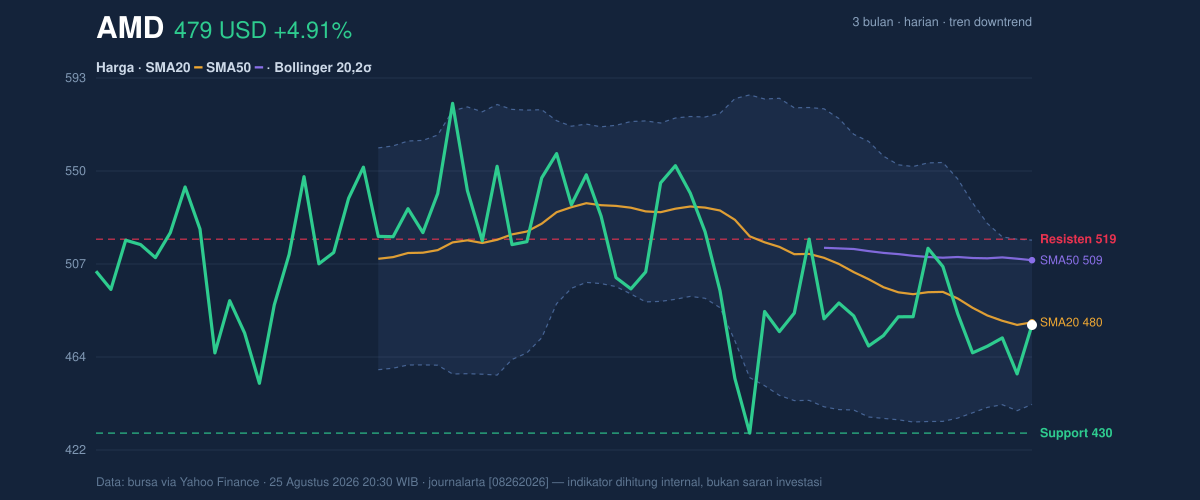
Price is currently positioned at about 56% of the 20-hour range between 429.56 support and 518.58 resistance. That placement is neither deeply depressed nor near breakout territory. It suggests AMD is in a balancing phase: buyers have stepped in, but they have not forced price back into the upper half of the range where momentum tends to strengthen.
The broader three-month frame reinforces that reading. The stock’s 3-month high is 584.73 and the 3-month low is 424.03. With the current price still much closer to the low than the high, the market is telling investors that the recovery remains incomplete. The recent one-month gain of 5.40% shows some repair, but the 5-day change of -1.08% warns that short-term follow-through has been uneven.
Oscillators & Momentum
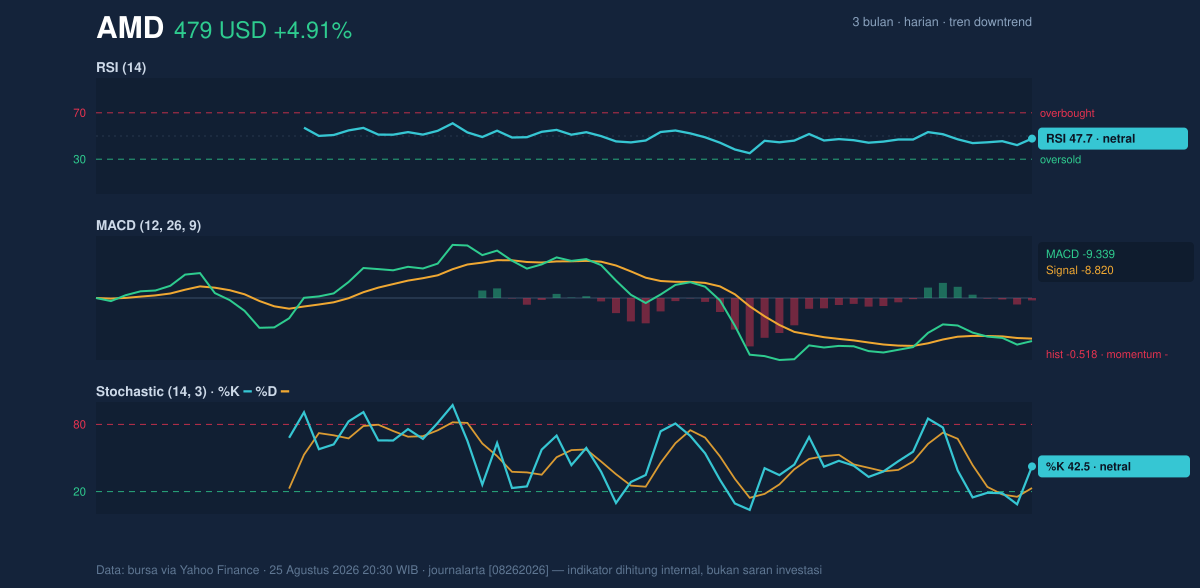
Momentum indicators are mixed rather than supportive. The RSI at 47.7 is neutral, which means the stock is neither stretched upward nor washed out. That matters because neutral RSI often reflects indecision: the market is not overbought, but it is also not showing the kind of oversold condition that frequently attracts aggressive dip-buying.
The Stochastic reading of %K 42.5 and %D 23.2 is also neutral, though the gap between the two lines hints at some short-term improvement. In practical terms, Stochastic is showing that recent price action has gained a little traction, but not enough to confirm a strong momentum turn. The bigger issue is the MACD at -9.339 versus signal -8.820, with a histogram of -0.518. That negative histogram means downside momentum still slightly outweighs upside force, even after the day’s rebound.
This is the key signal in the momentum set: AMD is not oversold enough to scream exhaustion, and it is not strong enough to claim a clean reversal. The chart is showing a market that is trying to stabilize while still carrying residual bearish momentum.
Volatility & Volume
Volatility is elevated. The ATR(14) of 20.63, equal to 4.3% of price, indicates that AMD can move sharply in either direction over a short period. That is useful context for reading the current setup: when ATR is high, even neutral technical structures can break quickly if a catalyst appears.
The Bollinger Bands add another layer. Price is near the middle band, with the upper band at 518.16, the middle at 480.43, and the lower band at 442.71. The %B reading of 48% says the stock is sitting close to the center of its recent volatility envelope, not pressing the top band and not testing the lower band. The 15.7% band width is normal, which means this is not a squeeze setup pointing to an imminent compression breakout. Instead, the bands suggest a market that has room to move, but no technical pressure yet to force that move.
Volume, however, is softer than ideal. Last trade volume was 18,951,900, below the 20-hour average of 24,919,500, or about 0.8x normal. That matters because rebounds with light volume often lack conviction. The encouraging counterpoint is that OBV is rising, which means cumulative volume flow is still tilting in a constructive direction even if the latest session did not show heavy participation. In other words, the market is seeing some accumulation beneath the surface, but not enough yet to overpower the broader downtrend.
Key Levels & Scenarios
The nearest technical floor is the 429.56 support. If AMD were to lose that area, it would expose the lower edge of the recent range and increase the chance that the stock revisits the 424.03 three-month low. On the upside, the first important barrier is 480.43, which is both the SMA20 and Bollinger middle band. Reclaiming that zone would be more than symbolic; it would show price has recovered the short-term trend line and is no longer trading below it.
Above that, the next resistance sits at 518.58, closely aligned with the 518.16 upper Bollinger band. That area is the market’s first real test of whether the rebound can extend into a stronger trend repair. If price can hold above the 20-day average and then push through the upper band zone, the chart would begin to shift from stabilization toward recovery. If it cannot, the current bounce risks fading back into the middle of the range.
Technical Verdict: HOLD (wait & see)
HOLD (wait & see)
- Reason 1: Price is still below the SMA20 at 480.43 and well under the SMA50 at 508.95, so the trend has not turned up.
- Reason 2: MACD remains negative, which means downside momentum is still present even after the rebound.
- Reason 3: RSI 47.7 and Stochastic 42.5 / 23.2 are neutral, so momentum is not confirming a decisive breakout or breakdown.
- Verdict invalidated if price breaks below 429.56, because that would weaken the current range and bring the 424.03 low back into focus.
- Ideal Entry Range: 429.56 to 480.43
- Exit Target: 518.58
- Stop Loss protection: below 429.56
For non-traders, this means AMD is not showing enough technical strength yet to call the rebound complete, but it is also not weak enough to suggest the recent recovery has fully failed.
“The market is waiting for AMD to prove this bounce is more than a pause.”
Summary Data AMD
| Last price | 479.18 USD |
| Change 1 day / 5 days / 1 month | 4.91% / -1.08% / 5.40% |
| Trend / MA-cross | downtrend / none |
| SMA20 / SMA50 | 480.43 / 508.95 |
| RSI (14) / Stochastic %K | 47.7 / 42.5 |
| Bollinger %B / ATR | 48% / 20.63 |
| Support / Resistance 20 days | 429.56 / 518.58 |
| Data as of | 25 Agustus 2026 20:30 WIB |
Track AMD stock price daily: live levels, support/resistance and our full AMD analysis history.



