BP Stock Drops 3.80%, Momentum Gains In Focus
On Agustus 26, 2026: price 528.60 GBp, trend sideways, RSI 52.2, support 514.90, resistance 552.50. technical analysis of bp stock. BP Stock Drops — full…
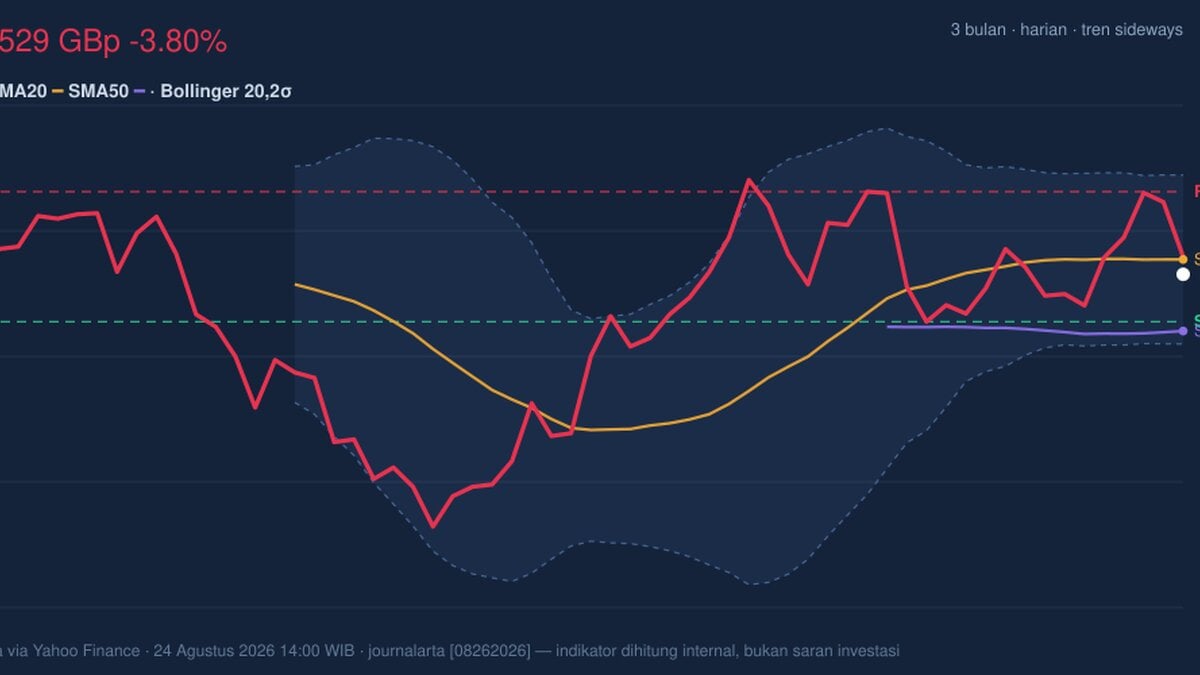
BP plc is trading in a tight mid-range on the London market, with the latest move pointing less to a clear trend than to a market that is still deciding whether recent weakness deserves follow-through. BP closed at 528.60 GBp on the LSE, down 3.80% on the day, but the broader technical picture still looks more like consolidation than breakdown.
Trend & Price Action
The share price sits below the SMA20 at 532.89 but above the SMA50 at 512.19, which is usually a sign of a stock caught between short-term softness and a still-intact medium-term base. There is no fresh MA cross, so the chart does not yet show a decisive shift in direction. That matters because moving averages often act like a vote on trend: when price is above the shorter average, buyers are in control; when it falls below, that control becomes less convincing. Here, BP is simply straddling the boundary.
The slope of the SMA20 is almost flat at 0.01% over 5 days, reinforcing the idea of a sideways market rather than a strong directional phase. As shown in the chart, BP is trading in the lower-middle part of its recent band, with support at 514.90 and resistance at 552.50. That places the stock at about 36% of the range, which is not weak enough to signal panic, but not strong enough to suggest buyers have regained the upper hand.
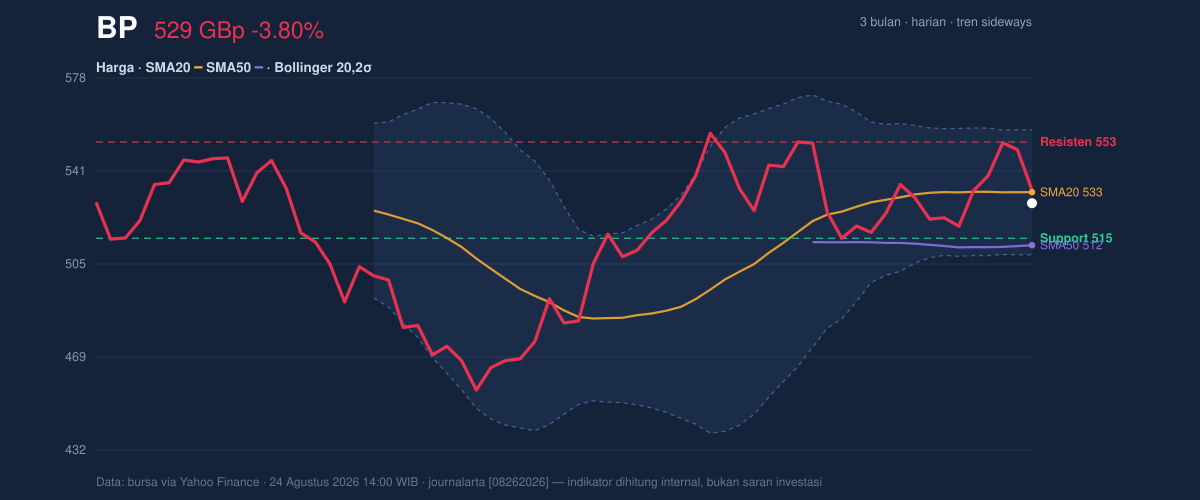
The broader three-month range adds context: 562.90 marks the recent high, while 450.60 is the low. BP is still materially above that floor, which means the market has not priced in a full trend reversal. But with the price now under the 20-day average, the immediate message is that momentum has cooled and the stock needs fresh demand to reclaim the middle of the band.
Oscillators & Momentum
Momentum is mixed rather than bearish. RSI at 52.2 is neutral, which tells readers that BP is neither overbought nor oversold. In plain terms, the market is not stretched in either direction. The Stochastic reading of 48.5 versus 66.7 also sits in neutral territory, but the %K line below %D suggests short-term momentum has eased. That is often what a pause looks like before either a bounce or another leg lower.
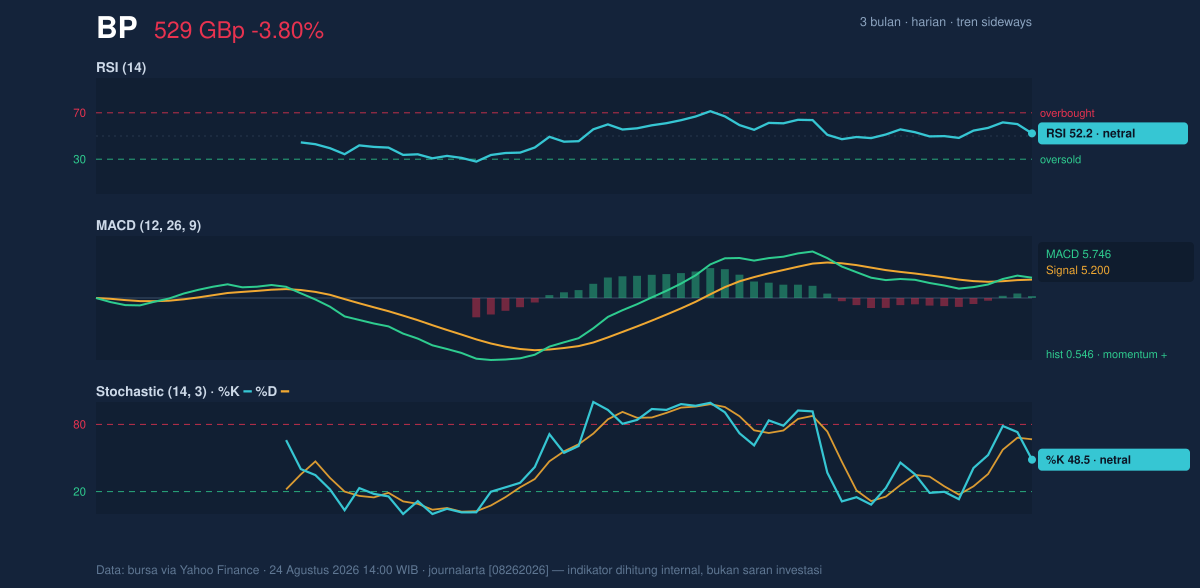
The more constructive signal comes from MACD. MACD at 5.746 is above the signal line at 5.200, leaving a positive histogram of 0.546. That means underlying momentum is still positive even though price has slipped below the short-term average. This divergence is important: it suggests sellers have not yet fully overwhelmed the trend, and the recent drop may be more a loss of near-term enthusiasm than a confirmed downtrend.
Volatility & Volume
Volatility remains contained. ATR at 12.60, equal to 2.4% of the share price, points to moderate daily movement rather than a disorderly swing. Bollinger Bands back that up: the band width is 9.2%, which is described as normal, not compressed enough to imply an imminent breakout, and not wide enough to suggest panic. The %B reading of 41% places BP below the middle of the band but well above the lower edge at 508.46. In practical terms, the stock is leaning weak without being technically oversold.
Volume is the one area where caution is warranted. The latest turnover of 24,659,159 compares with a 20-day average of 50,275,607, or about 0.5× normal activity. That means the day’s decline was not backed by heavy participation. When a stock falls on light volume, the move can reflect temporary positioning rather than a broad conviction trade. At the same time, OBV is rising, which suggests the longer-running accumulation trend has not fully broken down. In other words, volume does not confirm a major exit from the stock.
Key Levels & Scenarios
Support at 514.90 is the first level the market will likely test if weakness continues. A clean hold there would keep BP inside its current range and leave room for a rebound toward the middle of the Bollinger band and the SMA20 at 532.89. Above that, 552.50 resistance is the key ceiling: it is where recent rallies have likely met supply, and a move through it would improve the technical tone by pushing the price back toward the upper half of the band.
If BP fails to hold 514.90, the next reference is the 508.46 lower Bollinger band, which often acts as a short-term stress line. If the stock instead reclaims 532.89 and then 552.50, the chart would begin to look more like a basing pattern than a fading one. For now, the price is still in the middle of a range that has not resolved.
Technical Verdict: HOLD (wait & see)
HOLD (wait & see) fits the chart because BP is below the SMA20 but still above the SMA50, leaving the trend undecided rather than clearly negative. MACD remains positive, which argues against treating the latest drop as a confirmed breakdown, while RSI and Stochastic are neutral, showing neither oversold pressure nor a strong rebound signal. The light volume on the decline also means the move lacks strong confirmation.
- Ideal Entry Range: 514.90 to 532.89, where support and the 20-day average cluster.
- Exit Target: 552.50, with the upper Bollinger band at 557.32 as the next technical reference.
- Stop Loss Protection: 508.46, just below the lower Bollinger band and beneath the nearest support.
The message in plain English: BP is not flashing a clear warning, but it has not yet proven that the recent weakness is over.
The next technical checkpoint is whether the shares can recover 532.89 or whether the market tests 514.90 first.
Summary Data BP
| Last price | 528.60 GBp |
| Change 1 day / 5 days / 1 month | -3.80% / 1.73% / -1.07% |
| Trend / MA-cross | sideways / none |
| SMA20 / SMA50 | 532.89 / 512.19 |
| RSI (14) / Stochastic %K | 52.2 / 48.5 |
| Bollinger %B / ATR | 41% / 12.60 |
| Support / Resistance 20 days | 514.90 / 552.50 |
| Data as of | 24 Agustus 2026 14:00 WIB |
Track BP share price daily: live levels, support/resistance and our full BP analysis history.



