DIS Stock Technicals Today: Gains 0.58%, RSI Overbought
On Agustus 26, 2026: price 111.25 USD, trend uptrend, RSI 70.7, support 96.16, resistance 111.25. technical analysis of dis stock. DIS Stock Technicals — full…
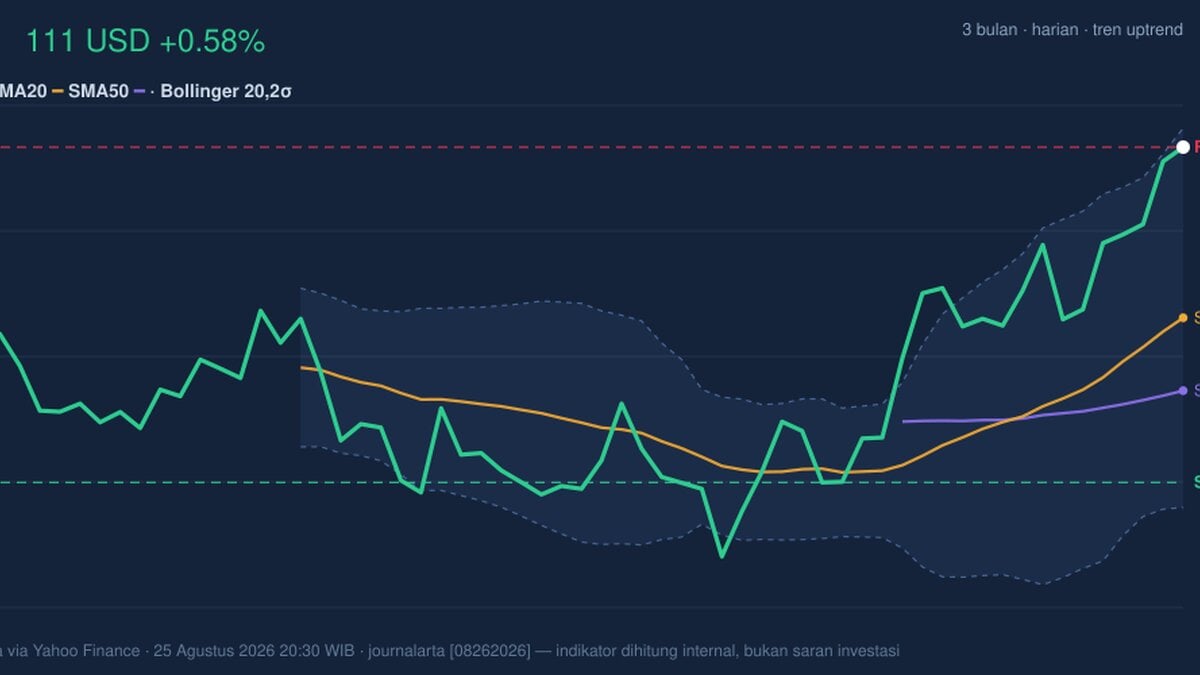
Walt Disney shares finished at 111.25 on the NYSE, up 0.58% from the previous close of 110.61, and the move matters because it pushed the stock to the very top of its recent range. The chart shows a name that is still in an uptrend, but also one that is now stretched: price is sitting above both the SMA20 at 103.57 and the SMA50 at 100.29, while momentum gauges are flashing overbought. In plain English, the trend is still pointing higher, but the stock has already done a lot of the climbing in a short period, which raises the odds of a pause or pullback rather than a clean, straight-line advance.
Trend & Price Action
The most important signal in the price structure is that Disney is trading above the SMA20 and SMA50, a classic sign that short-term and medium-term trend followers remain in control. The SMA20 slope of 3.23% over 5 days shows the trend is not just positive, but accelerating. That is reinforced by the 5-day gain of 7.02% and the 1-month rise of 12.50%. The lack of a fresh moving-average crossover does not weaken the case; it simply means the current trend is being extended by price strength rather than a new technical signal.
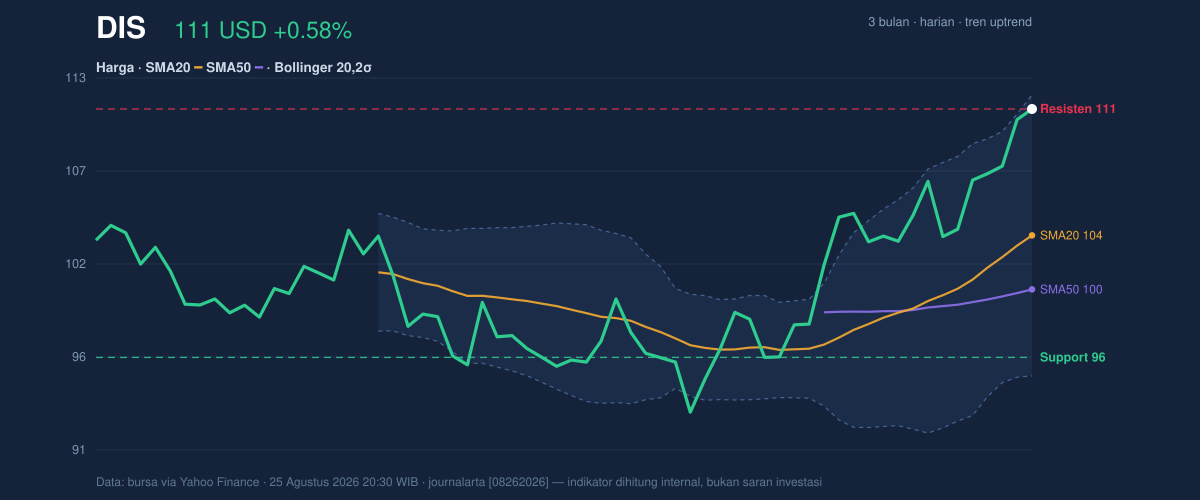
What stands out more is where the stock sits inside its own recent band: the 111.25 last price is effectively at the top of the 20-hour range, with support at 96.16 and resistance at 111.25. That means the market has already tested the upper boundary of the short-term range, leaving less room for immediate upside without first clearing overhead supply. The 3-month high of 111.87 is only slightly above current levels, so Disney is not far from a fresh range breakout, but it is close enough that traders will likely watch for hesitation near that ceiling.
A stock near the top of its range can still be strong. It just has less room to surprise.
Oscillators & Momentum
The momentum picture is more mixed than the trend picture. The RSI at 70.7 and Stochastic %K at 93.7 / %D at 91.8 both sit in overbought territory, which usually means the stock has risen quickly enough that near-term buyers may be getting crowded. Overbought does not automatically mean “about to fall”; it often means the stock is strong enough that it may need time to cool before it can extend further. That distinction matters here because the broader trend is still positive.
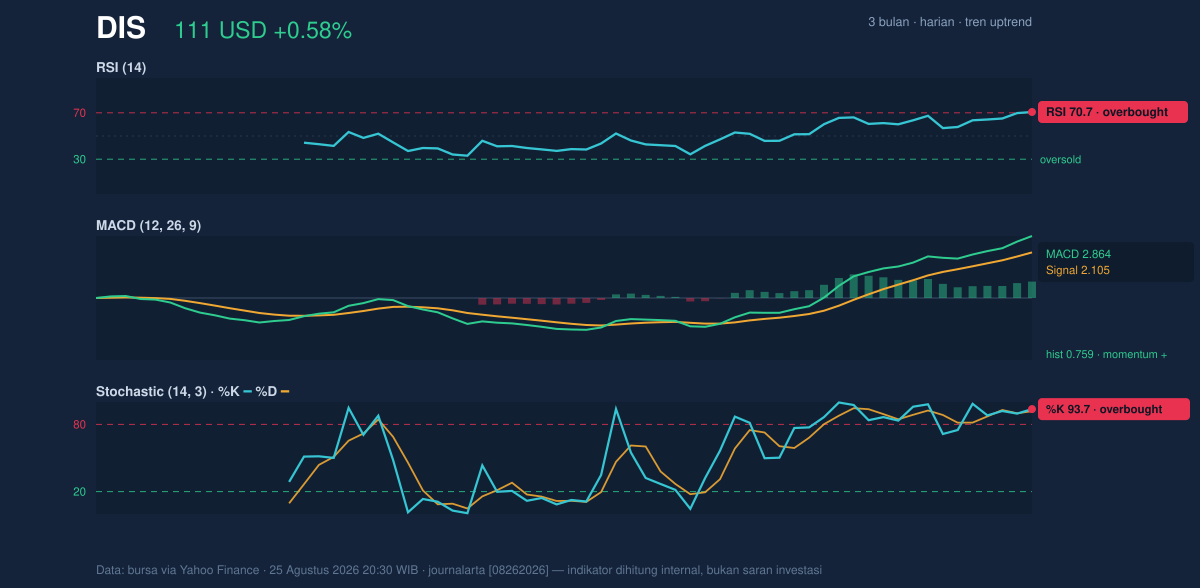
The MACD at 2.864 above its signal line at 2.105, with a 0.759 histogram, says upward momentum is still intact. In other words, the trend has not broken; it has simply become more extended. When RSI and Stochastic are overheated while MACD remains positive, the usual message is not reversal by default, but a warning that the stock may be vulnerable to a pause, especially if buyers stop showing up at the same pace.
Volatility & Volume
Disney’s Bollinger band upper level at 112.11 is now very close to the market price, and the %B reading of 95% shows price is pressing against the top of the band. That often signals a stretched condition: the stock is trading near the upper edge of its recent volatility envelope, which can be a sign of strength, but also a sign that short-term upside is becoming harder to sustain without consolidation. The Bollinger band width of 16.5% is described as normal, so this is not a volatility explosion; it is more of a controlled advance than a panic breakout.
The ATR of 2.25, equal to 2.0% of price, points to moderate daily movement. That matters because it suggests Disney can still swing meaningfully in either direction without changing the bigger trend. Volume, however, adds a cautionary note: the latest 6,747,100 shares traded are only 0.6× the 20-day average of 10,544,760. That means the latest push higher was not backed by heavy participation. The OBV is rising, which is constructive because it indicates net accumulation over time, but the lighter day-to-day turnover suggests the rally is not yet being confirmed by broad, urgent demand.
That combination often produces a pause before the next move.
Key Levels & Scenarios
The immediate technical ceiling is the 111.87 3-month high, with the 112.11 Bollinger upper band sitting just above it. If Disney can clear that zone, the chart would shift from “extended uptrend” toward “range breakout attempt.” If it fails there, the most likely response is a retreat toward the 103.57 SMA20, which also matches the Bollinger middle band and therefore acts as the first meaningful trend test. Below that, 100.29 on the SMA50 becomes the next line that would tell traders the recent rally has lost traction.
The short-term support at 96.16 is the deeper line in the sand. A move below that would do more than cool momentum; it would challenge the structure of the current advance.
Technical Verdict: HOLD (wait & see)
HOLD (wait & see)
- RSI at 70.7 and Stochastic %K/%D at 93.7/91.8 show the stock is overbought, which raises the odds of near-term consolidation.
- MACD at 2.864 above signal at 2.105 and a positive histogram confirm the uptrend is still active.
- Price is pressing the upper Bollinger band at 112.11 and sits near the 3-month high at 111.87, so upside is technically available but increasingly crowded.
Verdict invalidated if price breaks below 103.57, because that would mean the stock has slipped under the SMA20 and the Bollinger midpoint, weakening the current trend structure.
- Ideal Entry Range: 103.57 to 100.29
- Exit Target: 111.87 to 112.11
- Stop Loss protection: 96.16
In plain English: Disney still looks technically healthy, but it is stretched enough that the chart is asking for proof before the next leg higher.
“The stock is strong, but the next move needs to earn it.”
Summary Data DIS
| Last price | 111.25 USD |
| Change 1 day / 5 days / 1 month | 0.58% / 7.02% / 12.50% |
| Trend / MA-cross | uptrend / none |
| SMA20 / SMA50 | 103.57 / 100.29 |
| RSI (14) / Stochastic %K | 70.7 / 93.7 |
| Bollinger %B / ATR | 95% / 2.25 |
| Support / Resistance 20 days | 96.16 / 111.25 |
| Data as of | 25 Agustus 2026 20:30 WIB |
Track DIS stock price daily: live levels, support/resistance and our full DIS analysis history.



