HSBC Stock Technicals Today: Gains 0.18%, Momentum Weakens
On Agustus 26, 2026: price 163.20 HKD, trend sideways, RSI 52.3, support 160.10, resistance 168.20. technical analysis of hsbc stock. HSBC Stock Technicals —…
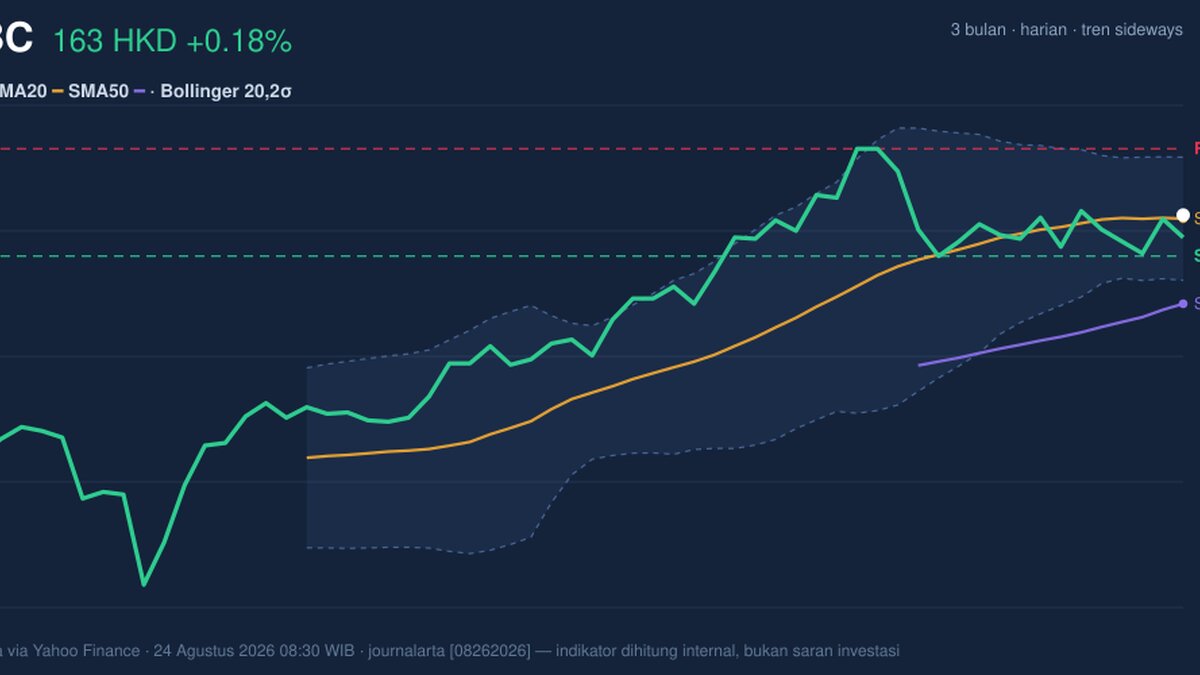
Hongkong and Shanghai Banking Corporation shares were little changed at HKD 163.20 on HKEX on 24 August 2026, edging up from HKD 162.90 as the stock stayed trapped in a narrow band between its near-term support and resistance. The price is still above the 20-day moving average at HKD 162.92 and well above the 50-day moving average at HKD 156.50, which tells traders the broader tape has not broken down even though the latest push higher has lacked conviction. The chart shows a market that is still functioning more like a pause than a trend reversal.
Trend & Price Action
The most important signal here is not the tiny daily gain, but the fact that HSBC remains in a sideways trend with the SMA20 slope at 0.21% over 5 days. That slope is modestly positive, meaning the short-term base is still inching higher rather than rolling over. At the same time, there is no fresh moving-average crossover, so the chart has not produced the kind of clean trend signal that would suggest a new leg up or down is already underway. In plain terms, the stock is coiling rather than committing.
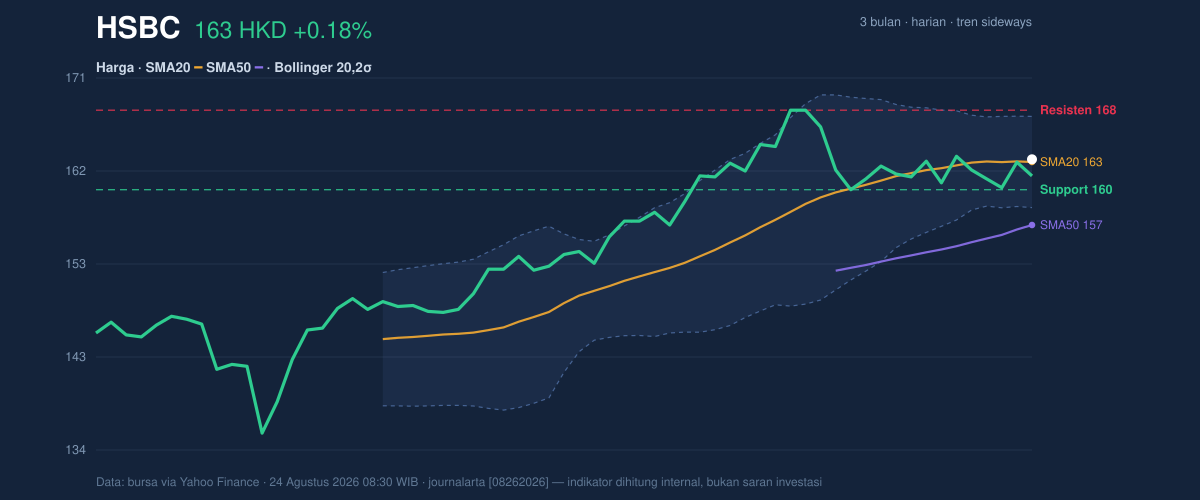
The location inside the range matters. HSBC is trading at roughly 38% of the 20-hour range, with support at HKD 160.10 and resistance at HKD 168.20. That positioning says the market is closer to the lower half of the recent band, but not close enough to support to imply stress. More importantly, the share price is still sitting above the Bollinger middle band at HKD 162.92, which usually acts as a short-term equilibrium line. When price hovers near that middle band, it often signals indecision: buyers and sellers are balanced, and the next directional move usually needs a catalyst.
The broader 3-month frame also supports that reading. HSBC is still below the 3-month high of HKD 169.70, but comfortably above the 3-month low of HKD 133.50. That keeps the chart in a recovery zone, not a breakdown zone.
Oscillators & Momentum
The momentum picture is less convincing than the price structure. RSI at 52.3 is neutral, which means the stock is neither stretched nor washed out. That sounds bland, but it is useful: a neutral RSI near the midpoint usually says there is room for either direction, depending on whether volume and trend confirmation appear. The Stochastic %K at 47.1 and %D at 38.1 also sit in neutral territory, with %K above %D but not by enough to signal a strong acceleration. In practical terms, the short-term impulse is improving, but only modestly.
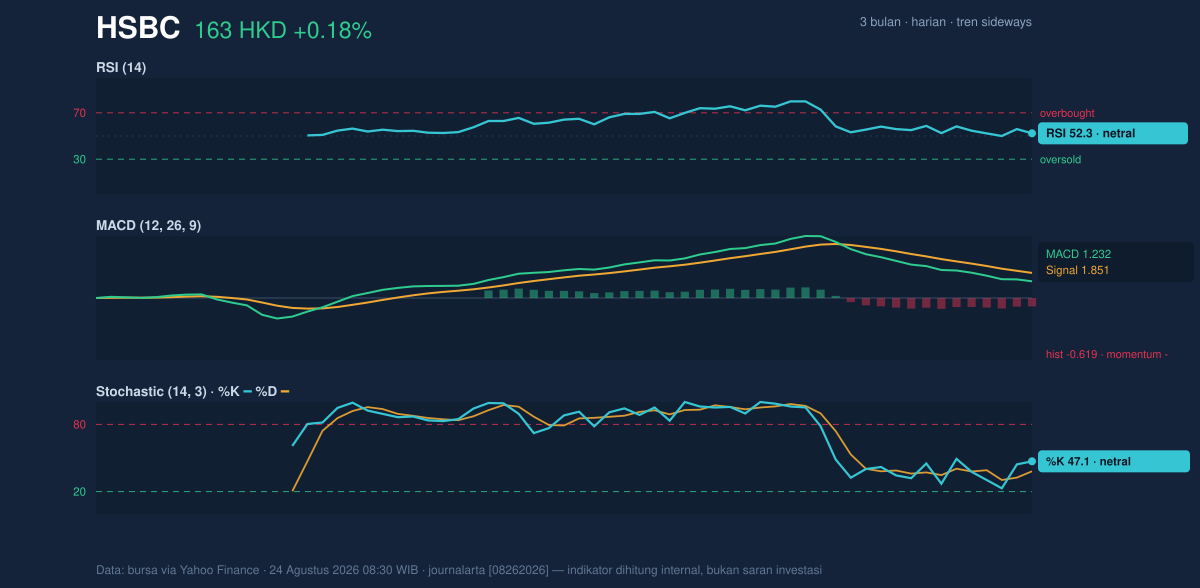
The more telling signal comes from MACD at 1.232 versus signal line 1.851, with a histogram of -0.619. MACD is a trend-following momentum tool, and a negative histogram means the faster line is still below the slower signal line. That is a warning that upside momentum has not yet overtaken the recent soft patch. So while the price is holding up, the internal thrust remains negative. This is the kind of setup where a stock can look stable on the surface but still need stronger buying pressure to escape the range.
Volatility & Volume
Volatility is not high, but it is compressing. The Bollinger Band width is 5.7%, described as a squeeze, which typically means the market is storing energy for a larger move. Squeezes do not tell direction; they tell timing. When price compression tightens while momentum remains mixed, the next break often becomes more meaningful than the drift that came before it. HSBC’s %B at 53% shows the price is sitting just above the middle of the band structure, again pointing to balance rather than urgency.
The ATR(14) at 2.49, or 1.5% of price, indicates moderate day-to-day movement. That is enough to allow a break from the range, but not enough to suggest disorderly trading. Volume, however, is the missing piece. The latest print of 10,625,499 shares is only 0.8 times the 20-day average of 12,977,765, and OBV is falling. OBV, or on-balance volume, tracks whether volume is supporting price advances or declines. A falling OBV while price stays firm means the rally effort is not being broadly backed by participation. That is a caution flag, not a collapse signal.
Key Levels & Scenarios
The market is now focused on two clean boundaries. On the downside, HKD 162.92 is the SMA20 and also the Bollinger middle band, making it the first line of technical defense. Below that, HKD 160.10 is the nearest support. If price slips under that area, the chart would start to look more vulnerable because the stock would be losing both its short-term average and the lower edge of the recent trading shelf.
On the upside, HKD 167.57 is the upper Bollinger band, while HKD 168.20 is the stated resistance. A move through that zone would matter because it would not just clear overhead supply; it would also suggest the current squeeze is resolving upward. Until then, the stock remains range-bound, with the burden of proof on buyers to show they can convert a stable base into a directional break.
Technical Verdict: HOLD (wait & see)
HOLD (wait & see)
- RSI at 52.3 and Stochastic at 47.1 / 38.1 are neutral, so momentum is not strong enough to confirm a breakout.
- MACD histogram at -0.619 remains negative, showing trend momentum is still lagging price stability.
- Bollinger Bands are squeezing and price is above the SMA20 at HKD 162.92, which argues for patience until the range resolves.
Verdict invalidated if price breaks below HKD 160.10.
- Ideal Entry Range: HKD 162.92 to HKD 160.10
- Exit Target: HKD 167.57 to HKD 168.20
- Stop Loss protection: below HKD 160.10
For non-traders: the chart says HSBC is holding steady, but it has not yet proved it can leave the current range.
The latest volume was 10,625,499 shares, below the 12,977,765 20-day average.
Summary Data HSBC
| Last price | 163.20 HKD |
| Change 1 day / 5 days / 1 month | 0.18% / -0.18% / 0.25% |
| Trend / MA-cross | sideways / none |
| SMA20 / SMA50 | 162.92 / 156.50 |
| RSI (14) / Stochastic %K | 52.3 / 47.1 |
| Bollinger %B / ATR | 53% / 2.49 |
| Support / Resistance 20 days | 160.10 / 168.20 |
| Data as of | 24 Agustus 2026 08:30 WIB |
Track HSBC share price daily: live levels, support/resistance and our full HSBC analysis history.



