ORCL Momentum Gains: Stock Gains 1.62% (Agustus 26, 2026)
On Agustus 26, 2026: price 144.76 USD, trend sideways, RSI 51.3, support 117.74, resistance 156.22. technical analysis of orcl stock. ORCL Momentum Gains —…
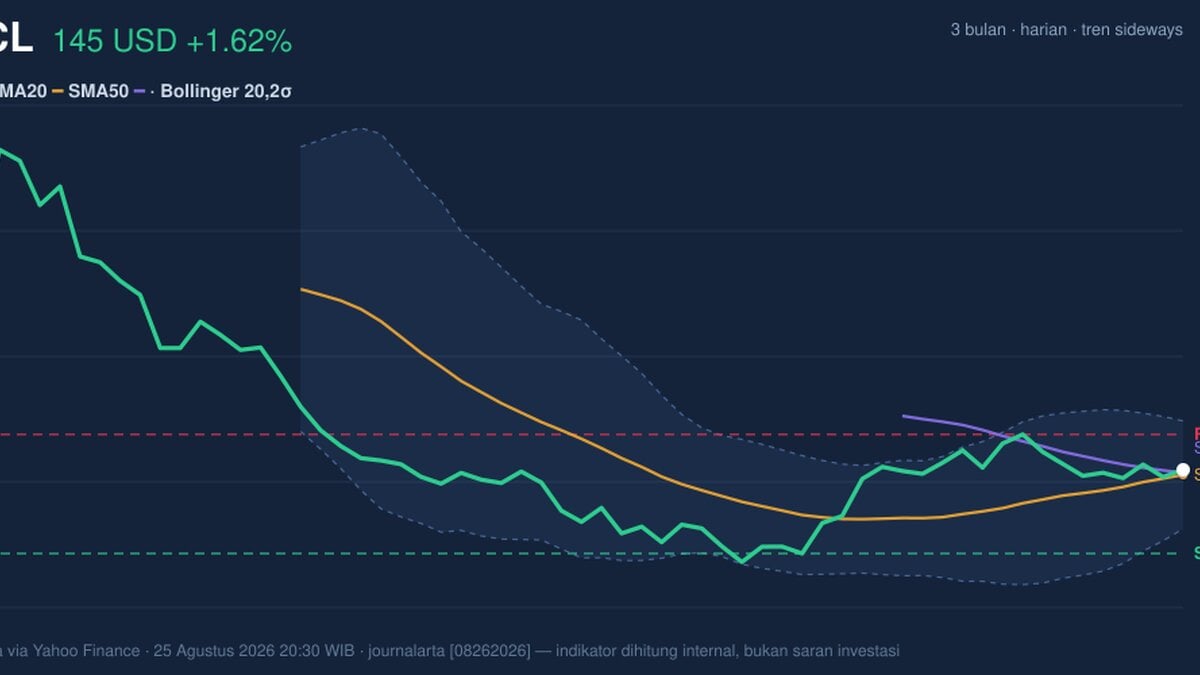
Oracle is trading with a firm short-term bid, but the chart still looks more like a market testing a range than one that has broken into a new trend.
Oracle closed at 144.76 USD, up 1.62% on the day and 20.67% over one month, according to Yahoo Finance data cited at 25 August 2026 20:30 WIB. That matters because the move is not just a one-day pop: it shows buyers have been willing to pay up for the shares after a weak patch, yet the stock remains inside a broader sideways structure. In plain terms, Oracle is recovering, but it has not fully escaped the range that has defined recent trading.
Trend & Price Action
The most important signal is that Oracle is trading above its SMA20 at 143.16 and also above its SMA50 at 143.81, which tells us the price has reclaimed both the short- and medium-term averages. That is usually a constructive sign: when price sits above these lines, it suggests recent demand is strong enough to keep the stock from slipping back into the lower part of its range. But the broader trend is still labeled sideways, and the absence of a new MA-cross means there is no fresh moving-average confirmation of a lasting trend shift yet.
As shown in the chart, Oracle is also sitting around 70% of its 20-hour range, with support at 117.74 and resistance at 156.22. That positioning says the stock is closer to the upper half of its recent band, but not yet at the ceiling. It is a useful middle-ground setup: the market is not pricing in collapse, yet it has not forced a clean breakout either.
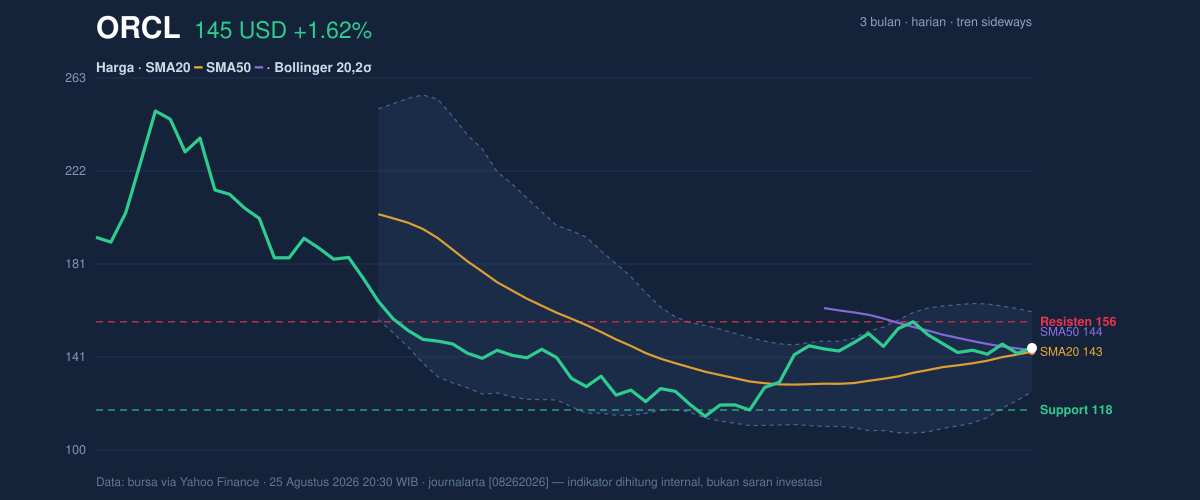
The broader three-month context is equally important. Oracle’s 3-month high is 250.25 and its 3-month low is 114.50. The current price is far above the low, which confirms the rebound has teeth, but still well below the recent peak, which reminds readers that the stock remains in recovery mode rather than full trend expansion.
A rebound, not a breakout.
Oscillators & Momentum
The momentum picture is more balanced than the price action alone suggests. Oracle’s RSI(14) at 51.3 is neutral, meaning the stock is neither overbought nor oversold. For non-specialists, RSI near 50 usually signals a market in equilibrium: buyers and sellers are roughly matched. That is consistent with the sideways trend, but it also leaves room for either direction if a catalyst appears.
The stochastic reading is similarly restrained, with %K at 33.6 and %D at 32.7. This is still neutral, but it leans toward the lower end of the range, which can suggest the stock has cooled off after recent gains without entering a true oversold condition. In other words, momentum has reset, but not enough to imply a strong reversal signal.
What stands out more clearly is the MACD. Oracle’s MACD at 0.839 is above the signal line at 0.444, with a positive histogram of 0.395. That combination means the short-term trend is still stronger than the longer-term trend, and the gap between MACD and signal line indicates buyers retain control in the background. It is a positive momentum reading, but because RSI and stochastic are still neutral, the chart is not screaming acceleration; it is saying support is there, but conviction is moderate.
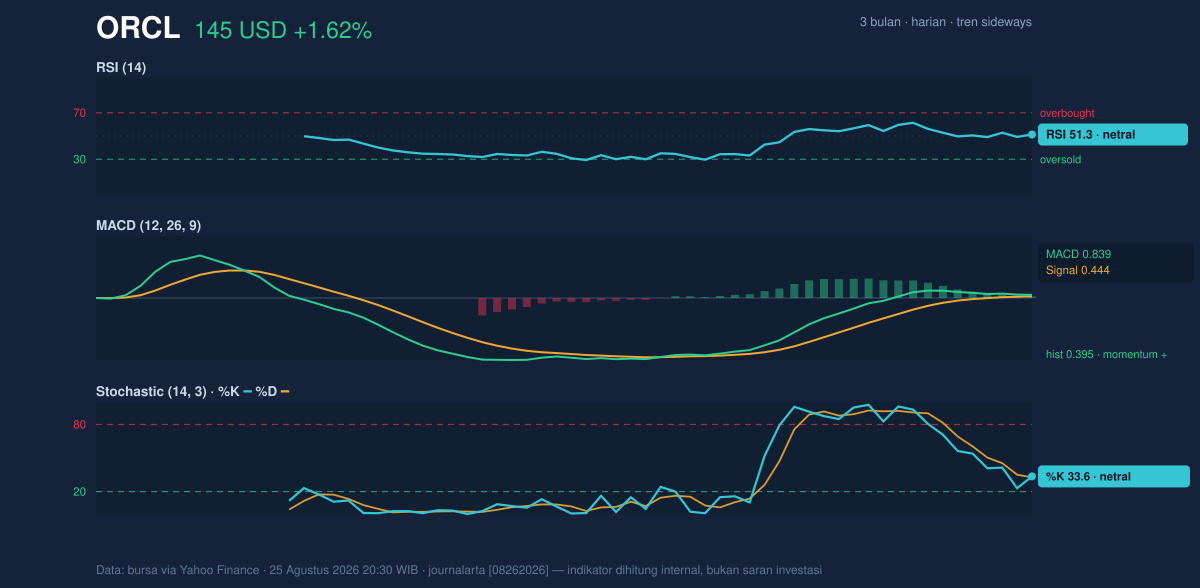
That mix matters. Momentum is positive, but not stretched.
Volatility & Volume
Volatility is elevated. Oracle’s ATR(14) is 6.32, or 4.4% of price, which means the stock can move meaningfully in a single session. The Bollinger Bands reinforce that point: the band width is 24.3% and is expanding, a sign that the market expects wider swings rather than quiet consolidation. Price is at %B 55%, which places it just above the middle of the band structure — not near an extreme, but with enough room to move either way.
That combination of expanding bands and a middling %B is often the signature of a market preparing for a directional decision. It does not tell us the direction by itself, but it does tell us the next move could be larger than recent day-to-day noise.
Volume adds a cautionary note. Last volume was 13,282,500 versus a 20-session average of 26,980,805, or about 0.5x, which is quiet. Low volume during a price rise can mean the move is not yet broadly confirmed by the market. Still, OBV is rising, and that matters because On-Balance Volume tracks whether trading flow is generally accumulating behind the price. Rising OBV suggests the recent advance has underlying support even if the latest session was not heavily traded.
Quiet trading, but accumulation is not absent.
Key Levels & Scenarios
The nearest technical map is straightforward. Support at 117.74 marks the lower boundary of the 20-hour range, while resistance at 156.22 is the first major ceiling. If Oracle continues to hold above the SMA20 at 143.16 and the SMA50 at 143.81, the chart stays constructive and the market remains positioned to test the upper range. If it fails to hold those averages, the move starts to look like a short-term rebound rather than a trend change.
The Bollinger framework adds another layer: with the upper band at 160.56, price has room to stretch if momentum improves, but the band’s current expansion also warns that any attempt higher could be met by sharper intraday swings. In practical terms, a push through resistance would need follow-through, not just a brief spike. If the stock stalls before 156.22, the chart remains range-bound.
Technical Verdict: HOLD (wait & see)
HOLD (wait & see)
- MACD is positive, with the line above signal and a positive histogram, which supports the recent rebound.
- Price is above SMA20 and SMA50, so the short-term structure is constructive even though the broader trend is still sideways.
- RSI and Stochastic are neutral, which means momentum is not strong enough to confirm a clean breakout.
- Verdict invalidated if price falls below 143.16, the SMA20 and Bollinger middle line, because that would weaken the current recovery structure.
- Ideal Entry Range: 143.16 to 143.81
- Exit Target: 156.22
- Stop Loss protection: 117.74
For non-traders: Oracle looks steadier than it did a month ago, but the chart still needs stronger confirmation before the move can be treated as more than a recovery inside a range.
“The market is saying Oracle can climb, but it has not yet proven it can stay there.”
Summary Data ORCL
| Last price | 144.76 USD |
| Change 1 day / 5 days / 1 month | 1.62% / 1.38% / 20.67% |
| Trend / MA-cross | sideways / none |
| SMA20 / SMA50 | 143.16 / 143.81 |
| RSI (14) / Stochastic %K | 51.3 / 33.6 |
| Bollinger %B / ATR | 55% / 6.32 |
| Support / Resistance 20 days | 117.74 / 156.22 |
| Data as of | 25 Agustus 2026 20:30 WIB |
Track ORCL stock price daily: live levels, support/resistance and our full ORCL analysis history.



