RSI Overbought, VZ Stock Gains 0.20% Today
On Agustus 26, 2026: price 50.25 USD, trend uptrend, RSI 70.3, support 46.11, resistance 50.25. technical analysis of vz stock. RSI Overbought — full details…
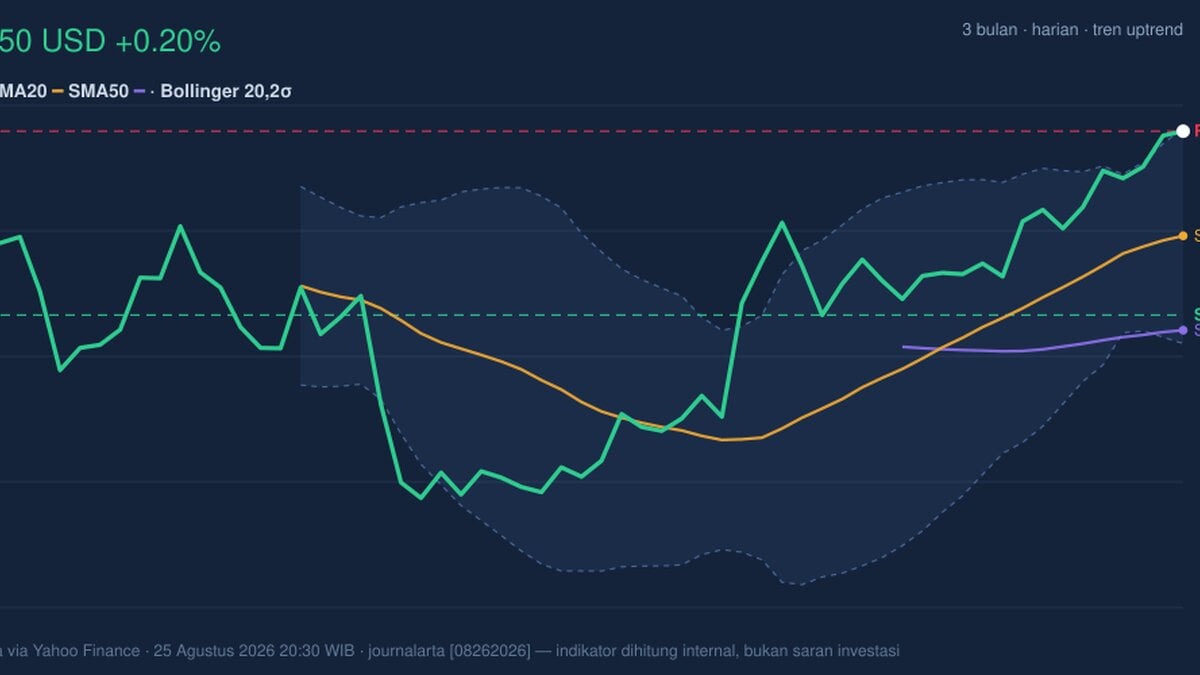
Verizon Communications Inc. (NYSE: VZ) edged to 50.25 USD on the New York Stock Exchange, up from a previous close of 50.15, as the shares pressed against the top of their recent trading band and extended a short-term advance that has been building for weeks. The move is modest in headline terms, but the signal is sharper than the percentage change suggests: the stock is sitting at the upper edge of its range, momentum is still positive, and the main question now is whether the rally is running on fresh demand or simply stretching into overbought territory.
Trend & Price Action
The broader structure remains constructive. Verizon is trading above its SMA20 at 47.89 and well above its SMA50 at 45.77, which means the price is holding above both the short- and medium-term trend markers that traders use to judge whether a move is gaining or losing traction. The uptrend is also supported by the SMA20 slope of 1.96% over 5 days, a sign that the recent lift is not flatlining.
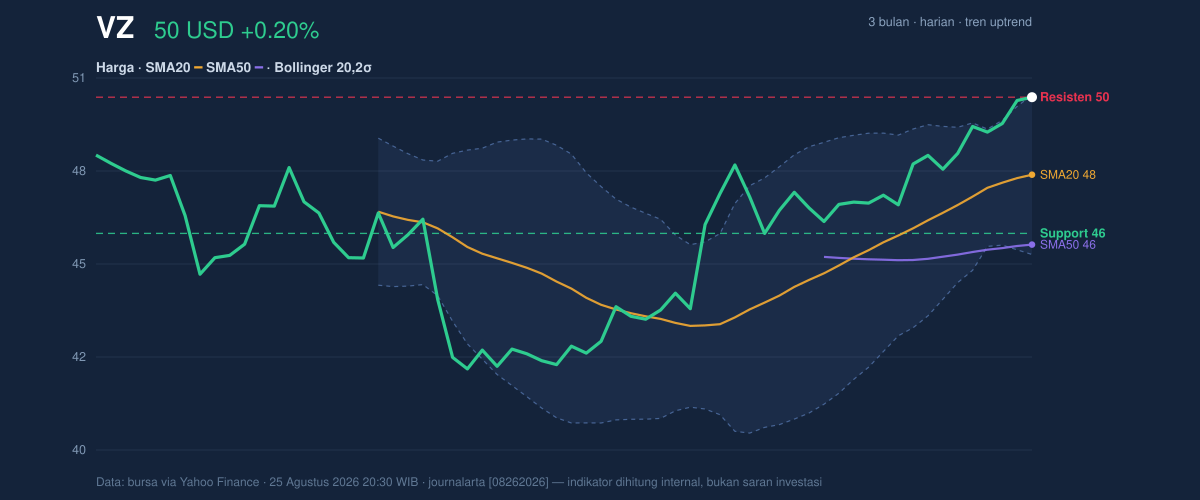
The chart also shows how tightly the stock has climbed into resistance. The 20-hour resistance at 50.25 now sits exactly where the last trade printed, while the 20-hour support at 46.11 marks the lower end of the current range. That means the market is no longer “cheap” within its own recent band; it is testing the ceiling. With the 3-month high at 50.33 only a few cents above the latest price and the 3-month low at 40.76 far below, the stock has already recovered most of the ground lost earlier in the quarter.
The Bollinger setup reinforces that reading. Price is near the upper band at 50.32, with %B at 99%, which means the share price is trading almost fully at the top of the banded range. In plain English, the market is stretched to the upside, but not necessarily reversing yet. The 10.1% Bollinger width is described as normal, so this is not a volatility explosion; it is a controlled push toward the upper boundary.
Oscillators & Momentum
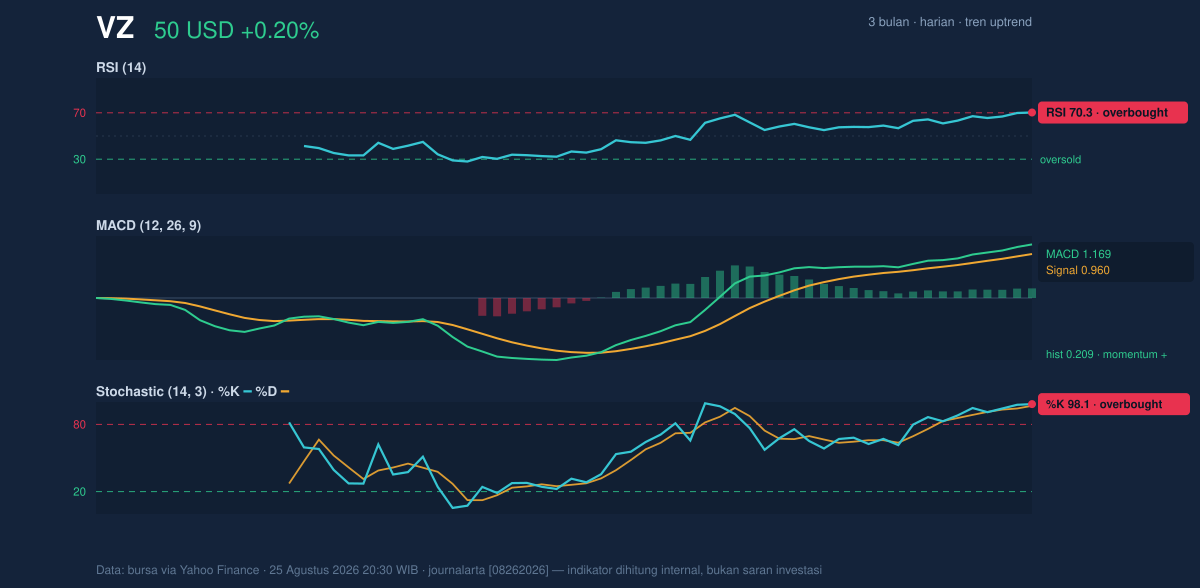
Momentum indicators are aligned in the same direction, but they are also warning that enthusiasm is crowded. The RSI at 70.3 is in overbought territory, which does not mean the stock must fall immediately; it means recent gains have been strong enough that traders should expect either consolidation or a pause if buying pressure cools. The Stochastic %K at 98.1 and %D at 96.6 are even more extended, showing the stock is closing near the top of its recent range and has been doing so consistently.
That matters because overbought readings are most useful when they appear late in a move. Here, they suggest the rally has momentum, but also that the easy part of the advance may already be behind it. The MACD at 1.169, above its signal line at 0.960 with a positive histogram of 0.209, says the trend is still backed by upward momentum rather than merely price drift. In other words, the oscillator picture is not bearish; it is simply mature.
Volatility & Volume
Volatility is contained rather than explosive. The ATR(14) at 0.80, equal to 1.6% of price, indicates a stock that is moving, but not wildly. That is important because it suggests any break above resistance may not be a disorderly spike; it could instead be a measured extension if demand persists. The volume of 21,337,600 versus the 20-hour average of 20,540,045 is roughly 1.0x normal, so participation is adequate but not emphatic.
The volume message becomes clearer when paired with OBV rising. On-balance volume tracks whether money is flowing into the stock across up days and down days. A rising OBV alongside a price pressing against resistance suggests accumulation is still present, even if it is not dramatic. That combination is more supportive than a price rise on weak participation, because it implies the move is being accepted rather than simply chased.
Key Levels & Scenarios
The market is now boxed between a nearby ceiling and a lower floor. The immediate reference points are 50.32 on the upper Bollinger band and 50.25 at the 20-hour resistance, with 46.11 as the key support level below. If price can clear and hold above the current ceiling, the chart leaves room for a continuation toward the 3-month high of 50.33 and potentially beyond that prior peak area. If it fails to hold the top of the range, the most natural test is a retreat back toward the middle of the Bollinger structure at 47.89, which also matches the SMA20.
The important nuance is that the trend is still upward, but the reward for new upside from here is narrower than it was a few sessions ago. The stock is not weak; it is simply extended. That is why the next move matters more than the last one.
Technical Verdict: HOLD (wait & see)
HOLD (wait & see)
- RSI at 70.3 and Stochastic %K/%D at 98.1/96.6 show the stock is overbought, so upside momentum is present but stretched.
- MACD at 1.169 above signal 0.960 and a positive histogram of 0.209 confirm the trend is still supported.
- Price is pressing the top of the range, with 50.25 resistance and the 50.32 Bollinger upper band acting as immediate hurdles, while the broader trend remains above SMA20 at 47.89 and SMA50 at 45.77.
Verdict invalidated if price breaks below 46.11.
- Ideal Entry Range: 47.89 to 46.11
- Exit Target (Target Price): 50.32 to 50.33
- Stop Loss protection: below 46.11
In plain English: Verizon still looks technically firm, but it is stretched near resistance, so the chart is asking for confirmation rather than enthusiasm.
“It’s holding the line for now, but the next move will decide whether this is a pause or the start of a much bigger test.”
Summary Data VZ
| Last price | 50.25 USD |
| Change 1 day / 5 days / 1 month | 0.20% / 3.52% / 4.27% |
| Trend / MA-cross | uptrend / none |
| SMA20 / SMA50 | 47.89 / 45.77 |
| RSI (14) / Stochastic %K | 70.3 / 98.1 |
| Bollinger %B / ATR | 99% / 0.80 |
| Support / Resistance 20 days | 46.11 / 50.25 |
| Data as of | 25 Agustus 2026 20:30 WIB |
Track VZ stock price daily: live levels, support/resistance and our full VZ analysis history.



