Shell Stock Drops 0.67% Today, Momentum Gains
On Agustus 26, 2026: price 3,386.50 GBp, trend uptrend, RSI 59.7, support 3,234.50, resistance 3,440.00. technical analysis of shell stock.
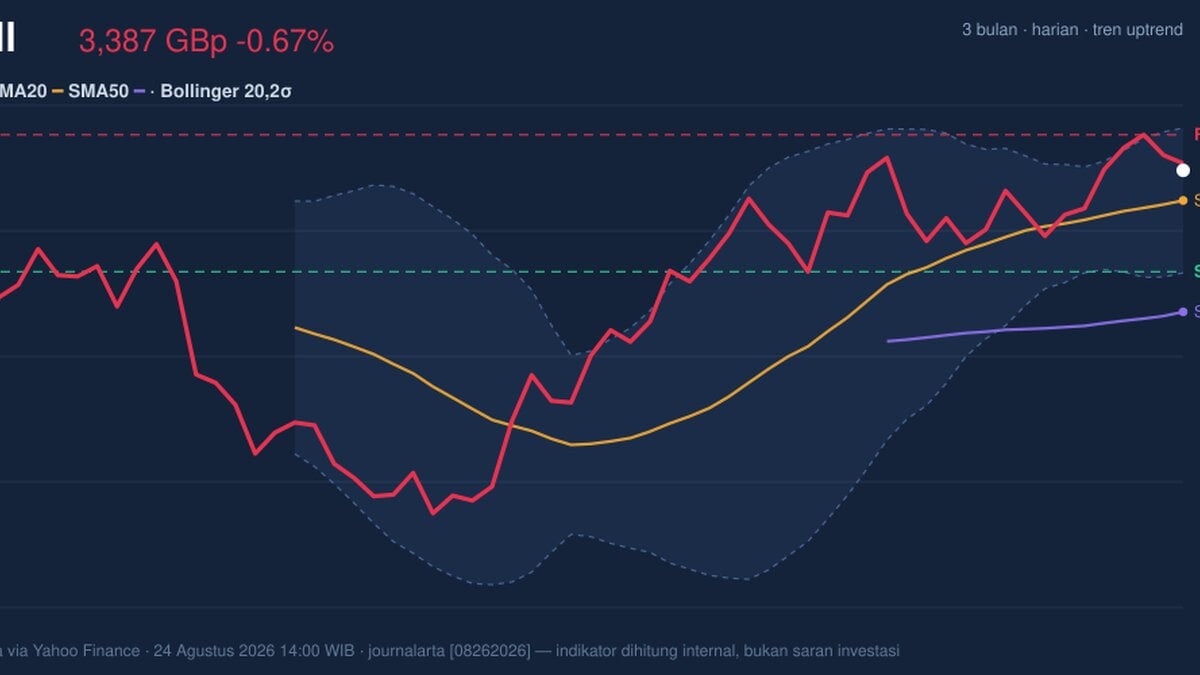
Shell plc traded lower on the London Stock Exchange on 24 August 2026, with Shell’s last price at 3,386.50 GBp, down 0.67% on the day, even as the shares remain above both key moving averages and within a broader uptrend. The move matters less as a one-day dip than as a test of whether buyers can keep the stock pinned above the short-term trend line after a steady month-long climb.
Trend & Price Action
The chart shows Shell sitting above its SMA20 at 3,341.48 and well above its SMA50 at 3,174.48, which is the clearest sign that the medium-term structure still favours the bulls. In plain language, the shares are trading above the average of the last 20 and 50 sessions, so the recent pullback is happening inside an established upward channel rather than against a broken trend.
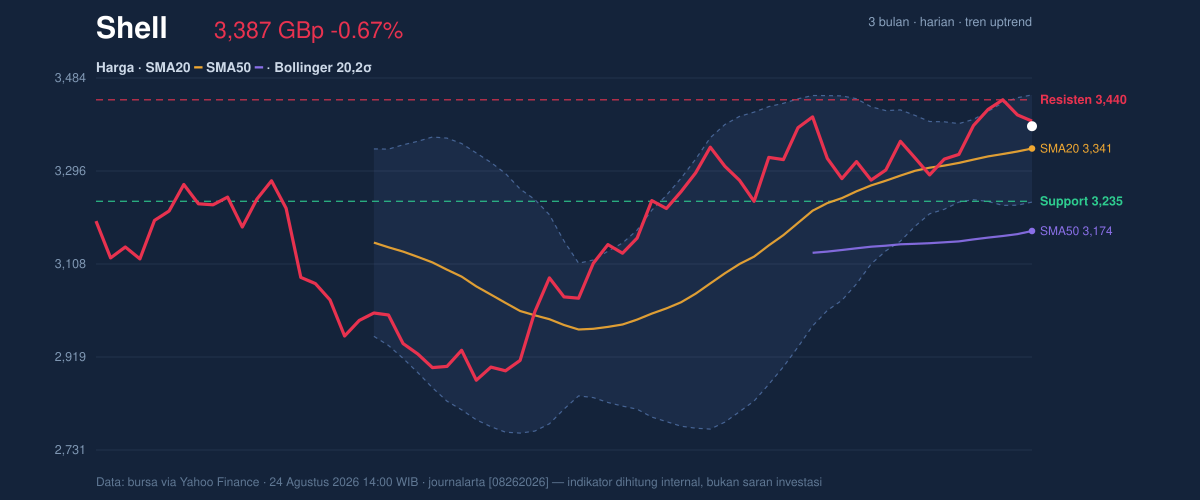
That positioning is important because the stock is also trading in the upper part of its recent range, at about 74% of the 20-hour range, with support at 3,234.50 and resistance at 3,440.00. The price is not far from resistance, which suggests the market is still willing to pay up for the name, but not yet confident enough to force a clean break higher.
The Bollinger band structure reinforces that message. Shell is above the middle band at 3,341.48 and below the upper band at 3,449.92, while the 6.5% band width points to a squeeze, or a period of compressed trading. A squeeze does not predict direction by itself; it signals that the stock has been coiling, and that the next move could be sharper than the recent daily drift once price leaves the current band.
Oscillators & Momentum
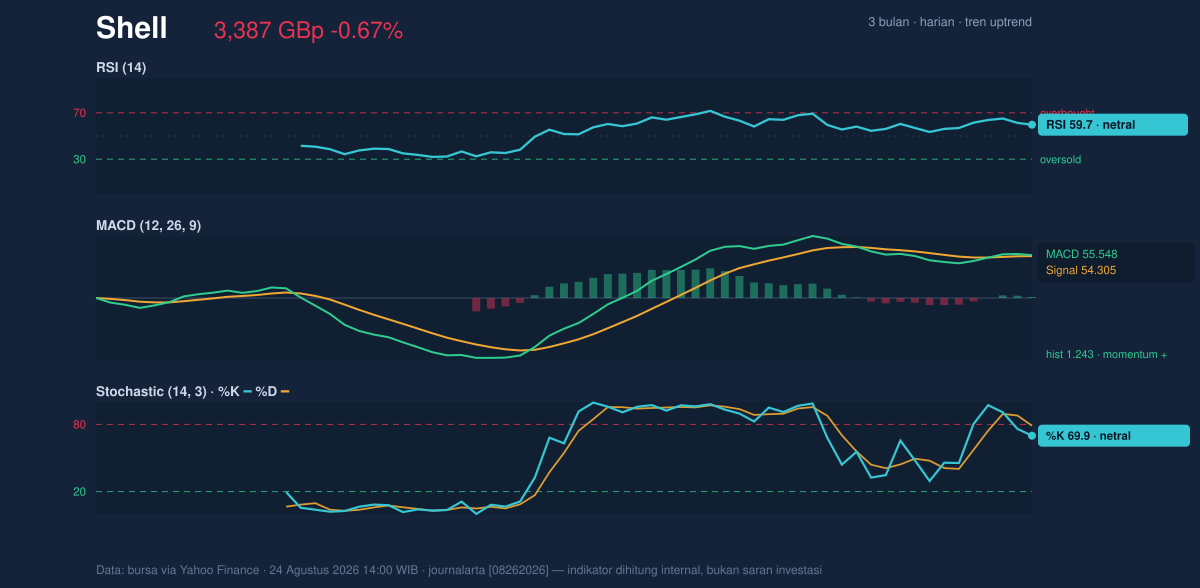
The momentum picture is constructive but not stretched. RSI at 59.7 is neutral-to-firm, which means Shell has room to extend without looking overbought, while Stochastic %K at 69.9 and %D at 78.9 shows near-upper-range momentum without an obvious reversal signal. In practical terms, the stock is gaining altitude, but the oscillator readings do not yet show the kind of overheating that often precedes a sharp reversal.
The more persuasive signal is the MACD at 55.548, above its signal line at 54.305, with a 1.243 histogram. That combination indicates positive momentum is still building, even if only moderately. MACD turning up while price remains above the moving averages usually means the trend is being supported by underlying participation rather than by a single burst of enthusiasm.
Volatility & Volume
Volatility is present, but not excessive. Shell’s ATR(14) at 53.45 equals 1.6% of price, which suggests typical daily movement remains manageable rather than explosive. That matters because the current squeeze in Bollinger width can sit alongside moderate ATR: one measure says the stock has not been swinging wildly, while the other says the market may be preparing for a larger directional move.
Volume is a little less convincing. The latest turnover of 7,127,230 shares is below the 20-hour average of 8,854,391, or about 0.8× normal, so the latest down day was not backed by heavy selling pressure. At the same time, OBV is rising, which is an important counterweight: on-balance volume tracks whether money flow is accumulating over time, and a rising OBV suggests buyers have been more persistent than the daily volume snapshot alone implies.
Key Levels & Scenarios
The immediate technical map is straightforward. 3,440.00 is the first level to watch on the upside, because it sits just above current price and aligns with the recent resistance band. If Shell clears that area, the upper Bollinger band at 3,449.92 becomes the next technical reference, and a move through both would confirm that the squeeze is resolving higher.
On the downside, 3,341.48 is the first meaningful support because it is both the SMA20 and the Bollinger middle band. A decisive break below that zone would weaken the short-term trend and signal that the recent rise is losing traction. Below that, 3,234.50 is the more important floor; if that support fails, the market would be moving back toward the lower band at 3,233.03 and away from the current bullish structure.
The broader context still leans constructive because the shares remain far above the 3,174.48 SMA50 and well within the 3,758.50 to 2,559.50 three-month range. That wider range shows there is still plenty of historical room above current levels, but the stock first has to prove it can hold the shorter-term trend rather than simply hovering under resistance.
Technical Verdict: HOLD (wait & see)
HOLD (wait & see) — Shell’s chart is constructive, but not yet decisive enough to call a clean continuation.
- MACD is positive, with the line above the signal line and a positive histogram, which supports the current uptrend.
- Price is above SMA20 and SMA50, confirming the trend remains intact even after the day’s pullback.
- Bollinger bands are squeezing, which often precedes a larger move, but direction has not been confirmed by volume.
- Verdict invalidated if price falls below 3,234.50, because that would break the nearest support and weaken the short-term bullish setup.
- Ideal Entry Range: 3,341.48 to 3,234.50
- Exit Target: 3,440.00 to 3,449.92
- Stop Loss Protection: below 3,234.50
For non-traders, that means Shell still looks technically healthy, but the chart is waiting for either a stronger push through resistance or a clear loss of support before the next move becomes obvious.
“We are not seeing a breakdown, but we are also not seeing the breakout yet,” a London-based market analyst said, capturing the tension around the shares as they hover just beneath resistance.
Summary Data Shell
| Last price | 3,386.50 GBp |
| Change 1 day / 5 days / 1 month | -0.67% / 1.71% / 3.34% |
| Trend / MA-cross | uptrend / none |
| SMA20 / SMA50 | 3,341.48 / 3,174.48 |
| RSI (14) / Stochastic %K | 59.7 / 69.9 |
| Bollinger %B / ATR | 71% / 53.45 |
| Support / Resistance 20 days | 3,234.50 / 3,440.00 |
| Data as of | 24 Agustus 2026 14:00 WIB |
Track Shell share price daily: live levels, support/resistance and our full Shell analysis history.



