Singtel Stock Gains 2.05% Today, Momentum Gains
On Agustus 26, 2026: price 4.49 SGD, trend sideways, RSI 50.8, support 4.25, resistance 4.61. technical analysis of singtel stock. Singtel Stock Gains — full…
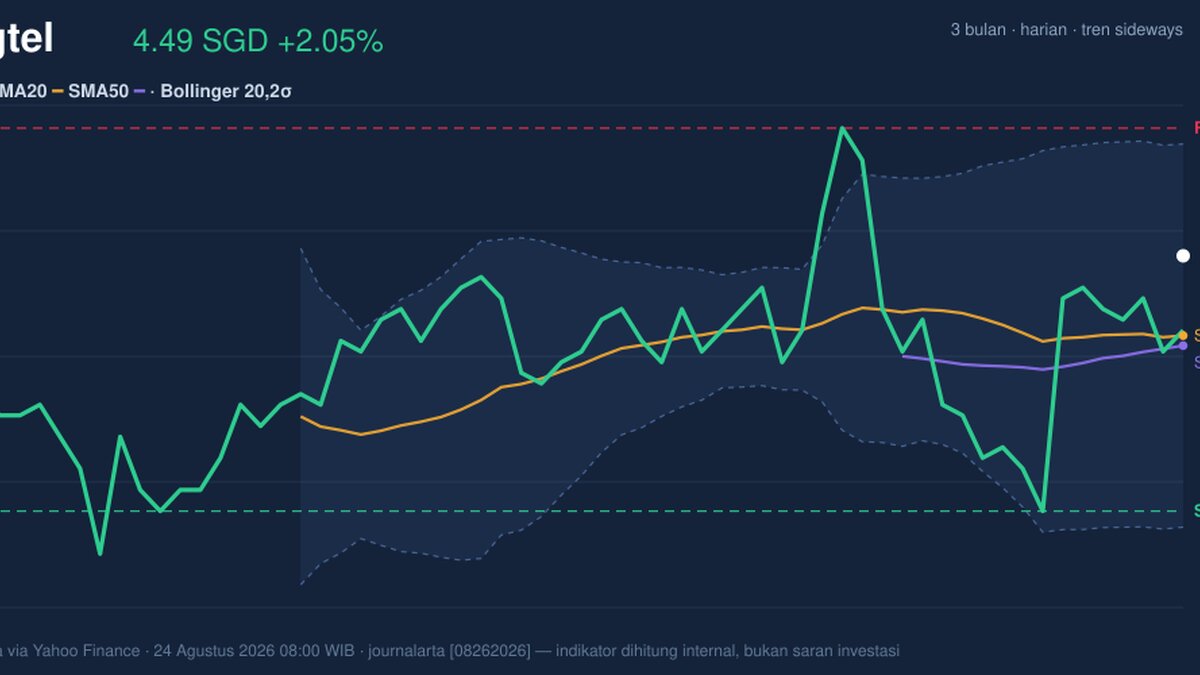
Singapore Telecom (Singtel) edged up to SGD 4.49 on SGX by 24 August 2026 08:00 WIB, adding 2.05% from the previous close of 4.40 as the stock held above both its short- and medium-term averages. The move keeps the counter in a sideways pattern rather than a clean uptrend, but the price is now sitting in the upper half of its recent trading band, which tells investors the market is willing to pay a little more without yet committing to a breakout.
Trend & Price Action
The key signal in the chart is that Singtel is trading above SMA20 at 4.42 and above SMA50 at 4.41, with no fresh moving-average crossover. That matters because when price sits above both averages, it usually means the market has recovered enough to stop leaning bearish, but the lack of a new cross says conviction is still limited. In other words, this is more a stabilisation phase than a trend acceleration.
The slope of SMA20 is only 0.03%/5 days, which reinforces the sideways reading. A flat average suggests buyers and sellers are roughly balanced, and the stock is drifting rather than trending hard in either direction. As shown in the chart, the price is also positioned around 67% of the 20-hour range, so it is closer to resistance than support, yet not close enough to imply an immediate breakout.
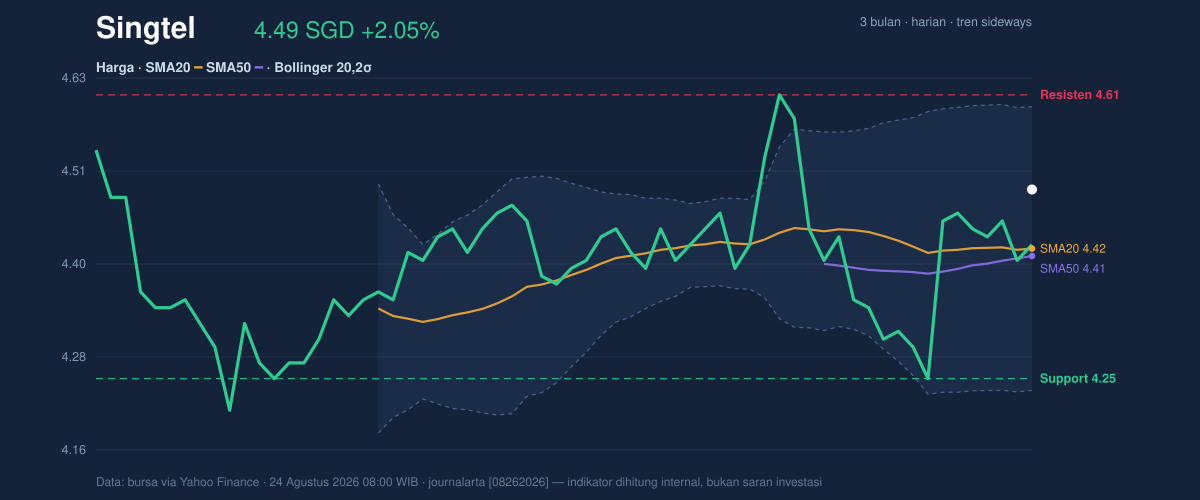
The nearest technical ceiling is SGD 4.61, while nearby support sits at SGD 4.25. That gap frames the current market mood well: the stock is trading inside a range, and the upper bound is being tested more by optimism than by volume-backed demand. The 3-month high of 4.70 remains the next obvious overhead reference, while 4.15 marks the lower end of the broader recent range.
Oscillators & Momentum
Momentum is improving, but only modestly. The RSI(14) at 50.8 is neutral, which means the stock is neither overbought nor oversold and has room to move in either direction. That is important because a neutral RSI often accompanies a market that is waiting for a catalyst rather than one already in motion.
The Stochastic %K at 79.3 and %D at 80.5 are also still described as neutral, though they sit near the upper end of the scale. In plain language, this suggests the stock has recently gained enough to approach short-term exhaustion, but not enough to confirm a reversal. As shown in the momentum chart, the oscillator is not flashing a strong warning; it is simply closer to the top of its recent range than the bottom.
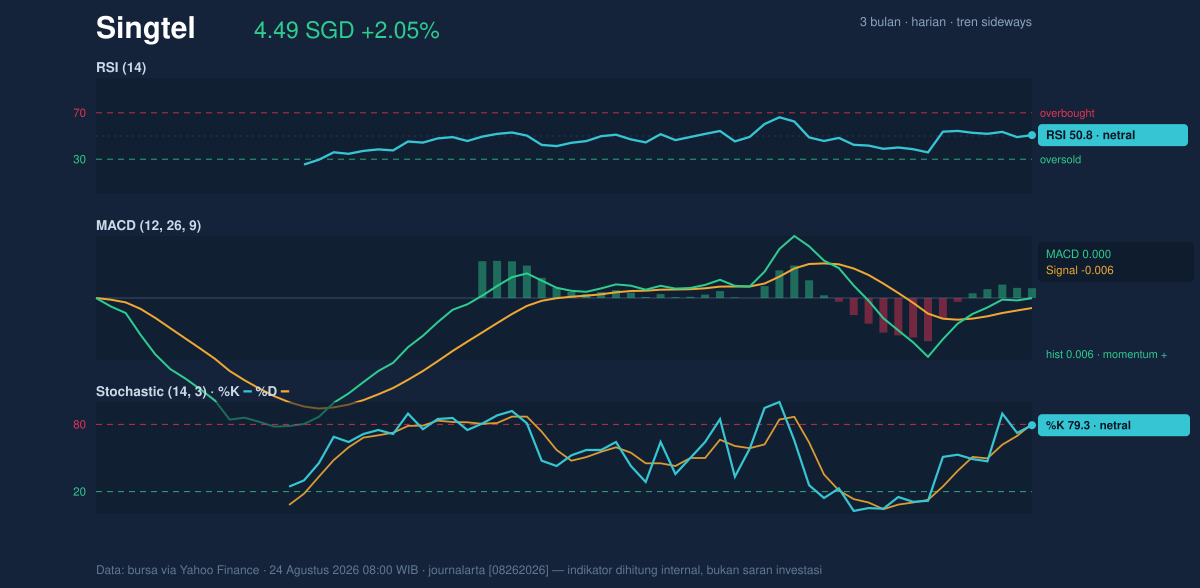
The more constructive detail is the MACD at 0.000 with a signal line at -0.006 and histogram at 0.006. MACD measures whether recent price action is strengthening or fading. A positive histogram, even a small one, means short-term momentum has nudged above the signal line, which is a mild bullish confirmation. It is not a powerful trend signal, but it does suggest the recent advance has not yet run out of steam.
Volatility & Volume
Volatility is contained. The Bollinger Bands show an upper band at 4.60, a middle band at 4.42, and a lower band at 4.23, with %B at 71% and band width at 8.2%, described as normal. %B above 50% means price is trading in the upper half of the band structure, which usually signals constructive positioning. But the band width is not especially tight, so this is not a classic squeeze setup that would usually precede a sharp move.
That said, the stock is still close enough to the upper band that further gains would need confirmation. If price pushes through 4.60, the chart would begin to shift from range-trading to breakout-watch territory. If it fails there, the middle band around 4.42 becomes the first line of defence.
Trading participation is the weak spot. Last volume was 17,084,623, below the 20-hour average of 30,942,174, or about 0.6× normal. That matters because price advances on light volume often lack follow-through. The OBV is down, which means cumulative volume flow has not yet confirmed the price rise. So while the stock is edging higher, the broader participation signal is still cautious.
Key Levels & Scenarios
The current setup is straightforward. SGD 4.61 is the first resistance that matters, because it aligns with the recent range ceiling and sits just above the upper Bollinger band at 4.60. A clean move above that zone would suggest buyers are finally absorbing supply. On the downside, SGD 4.42 is the Bollinger middle line and also near SMA20, making it the first meaningful pivot. Below that, SGD 4.25 is the key support that would need to hold to keep the broader range intact.
If price holds above 4.42 and volume improves, the chart would favour a gradual test of 4.61 and then the 4.70 3-month high. If it slips below 4.42, the market would likely revert to a more defensive stance, with 4.25 becoming the level to watch for a deeper retracement.
Technical Verdict: HOLD (wait & see)
HOLD (wait & see) is the clearest reading because the stock is technically firmer, but not yet strong enough to call a decisive breakout.
- RSI at 50.8 is neutral, so momentum is balanced rather than decisive.
- MACD histogram at 0.006 is positive, but the signal is still mild and not fully confirmed by volume.
- Volume at 0.6× average and OBV down argue against chasing the move before participation improves.
Verdict invalidated if price breaks below SGD 4.25.
- Ideal Entry Range: SGD 4.42 to 4.45
- Exit Target: SGD 4.60 to 4.61
- Stop Loss protection: below SGD 4.25
In plain English: Singtel is leaning firmer, but the chart still needs stronger volume to prove the recent rise is more than a range-bound bounce.
Summary Data Singtel
| Last price | 4.49 SGD |
| Change 1 day / 5 days / 1 month | 2.05% / 0.67% / 2.28% |
| Trend / MA-cross | sideways / none |
| SMA20 / SMA50 | 4.42 / 4.41 |
| RSI (14) / Stochastic %K | 50.8 / 79.3 |
| Bollinger %B / ATR | 71% / 0.08 |
| Support / Resistance 20 days | 4.25 / 4.61 |
| Data as of | 24 Agustus 2026 08:00 WIB |
Track Singtel share price daily: live levels, support/resistance and our full Singtel analysis history.



