T RSI Overbought: Stock Gains 0.31% (Agustus 26, 2026)
On Agustus 26, 2026: price 25.77 USD, trend uptrend, RSI 71.0, support 23.06, resistance 25.77. technical analysis of t stock. RSI Overbought — full details…
By matthew jonathan
August 26, 20265 min read
T RSI Overbought
AT&T closed at $25.77, up 0.31% on the day and now sitting just below the 20-day Bollinger upper band at $25.98. The stock has climbed 3.49% over five days and 4.50% over a month, a run that keeps the chart pointed higher — but also leaves it stretched, with momentum indicators flashing the kind of overbought readings that often appear near a short-term pause.
Trend & Price Action
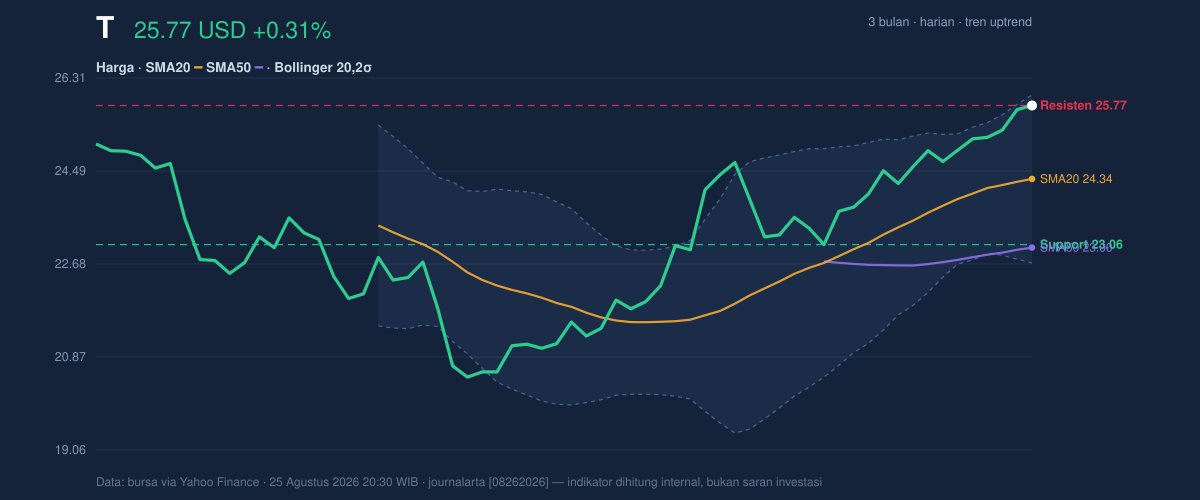
AT&T is still trading in an uptrend, and the slope of the SMA20 at 1.63% over five days shows the short-term trend is not just intact, but accelerating. Price is above both the SMA20 at $24.34 and the SMA50 at $23.00, which matters because it tells investors the stock is holding above both its near-term and medium-term average cost bases. That usually signals that recent buyers have been willing to pay up rather than fade the move.
There is no new MA-cross, so this is not a fresh crossover story. Instead, it is a continuation pattern: price has already moved above the averages, and the question now is whether it can digest gains without losing the trend. As shown in the chart, the stock is also pressing the top of its recent range, with 20-hour support at $23.06 and 20-hour resistance at $25.77, meaning it is effectively at 100% of the range. That positioning usually leaves little room for complacency.
3-month price action chart of T: price, SMA20/50, Bollinger, support & resistance. Data: exchange via Yahoo Finance.
The broader three-month range gives that move context: the 3-month high is $25.87 and the 3-month low is $19.89. AT&T is now trading close to the upper end of that band, which suggests the market has already re-rated the shares in the near term. The signal is not that the trend is exhausted, but that it is now being tested at a level where follow-through matters more than the first leg higher.
Oscillators & Momentum
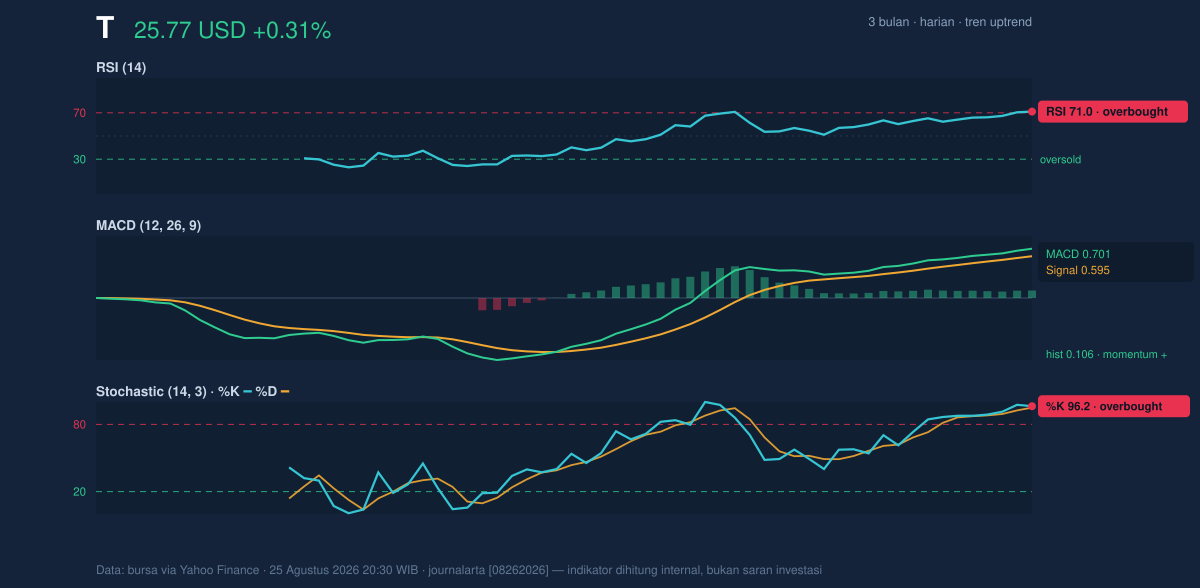
Momentum is still positive, but it is no longer subtle. The RSI(14) at 71.0 is in overbought territory, and the Stochastic %K at 96.2 with %D at 95.0 is also overbought. In plain English, that means the stock has risen fast enough that short-term traders may already be crowded on the same side of the trade. Overbought does not automatically mean “about to fall”; it means the stock has become vulnerable to a breather if fresh buying slows.
The MACD at 0.701, above the signal line at 0.595, still confirms upward momentum. The histogram at 0.106 shows the trend remains positive, but the size of that edge is modest relative to the overbought oscillators. That combination is important: momentum is still supportive, yet it is running ahead of itself. As shown in the chart, the momentum panel suggests strength is intact, but the stock may need time rather than price to do the work next.
Momentum chart of T: RSI(14), MACD, Stochastic. Data: exchange via Yahoo Finance.
That tension between a rising MACD and stretched RSI/Stochastic often marks a stock that can stay firm, but not necessarily advance in a straight line. For AT&T, the signal is less “breakout ignition” and more “trend still alive, but increasingly mature.”
Volatility & Volume
The Bollinger Bands help frame how extended the move is. Price is near the upper band at $25.98, with %B at 94%, which means the stock is trading very close to the top of its recent volatility envelope. The band width of 13.4% is described as normal, so this is not a volatility squeeze that is about to snap open in a dramatic way. Instead, the chart suggests a steady trend inside a standard volatility regime.
The ATR(14) at 0.49, or 1.9% of price, points to moderate volatility. That matters because it implies the stock can move, but not violently enough to override the broader trend in one session. For investors reading the tape, that combination — normal Bollinger width and moderate ATR — suggests any near-term move is more likely to be a controlled continuation or a controlled pullback rather than a disorderly swing.
Volume adds a cautionary note. The latest trade volume of 28,823,000 was only 0.7× normal versus the 20-hour average of 41,438,520. That means the stock advanced without full participation from the broader market. In technical terms, rising price on lighter volume can still work, but it usually carries less conviction than a move backed by heavier turnover. The good news is that OBV is rising, which suggests cumulative buying pressure is still improving even if the most recent session did not attract peak activity.
Key Levels & Scenarios
The immediate map is tight. Support at $23.06 is the first level that would tell traders whether the recent advance is holding together. Below that, the SMA20 at $24.34 becomes an important pivot because it marks the short-term average price. On the upside, resistance at $25.77 has already been tested, while the upper Bollinger band at $25.98 and the 3-month high at $25.87 define the next ceiling.
If AT&T can hold above the SMA20 at $24.34, the chart remains constructive. If it slips back below $23.06, the tone changes quickly because that would mean the recent breakout has lost its base. The key point is that the stock is now trading in the part of the range where gains are easier to measure than to extend.
Technical Verdict: HOLD (wait & see)
HOLD (wait & see)
- RSI at 71.0 and Stochastic %K/%D at 96.2/95.0 are both overbought, which warns the stock may need to cool off.
- MACD at 0.701 above signal at 0.595 still supports the uptrend, so the chart is not broken.
- Price is near the Bollinger upper band at $25.98 and close to 3-month high at $25.87, meaning upside is being tested at a crowded level.
- Verdict invalidated if price falls below $23.06, where short-term support is defined.
- Ideal entry range:$24.34 to $25.06, using the SMA20 and the area just below recent resistance.
- Exit target:$25.87 to $25.98, based on the 3-month high and upper Bollinger band.
- Stop loss protection:below $23.06, where the short-term support sits.
In plain English: the trend is still up, but the stock is already near a place where it may need to rest before it can go further.
The next test is whether buyers can keep AT&T above $25.77 without relying on thin volume to do it.