Tencent Stock Analysis: Drops 3.28%, Testing Support Level
On Agustus 26, 2026: price 442.00 HKD, trend sideways, RSI 42.4, support 440.00, resistance 492.20. technical analysis of tencent stock.
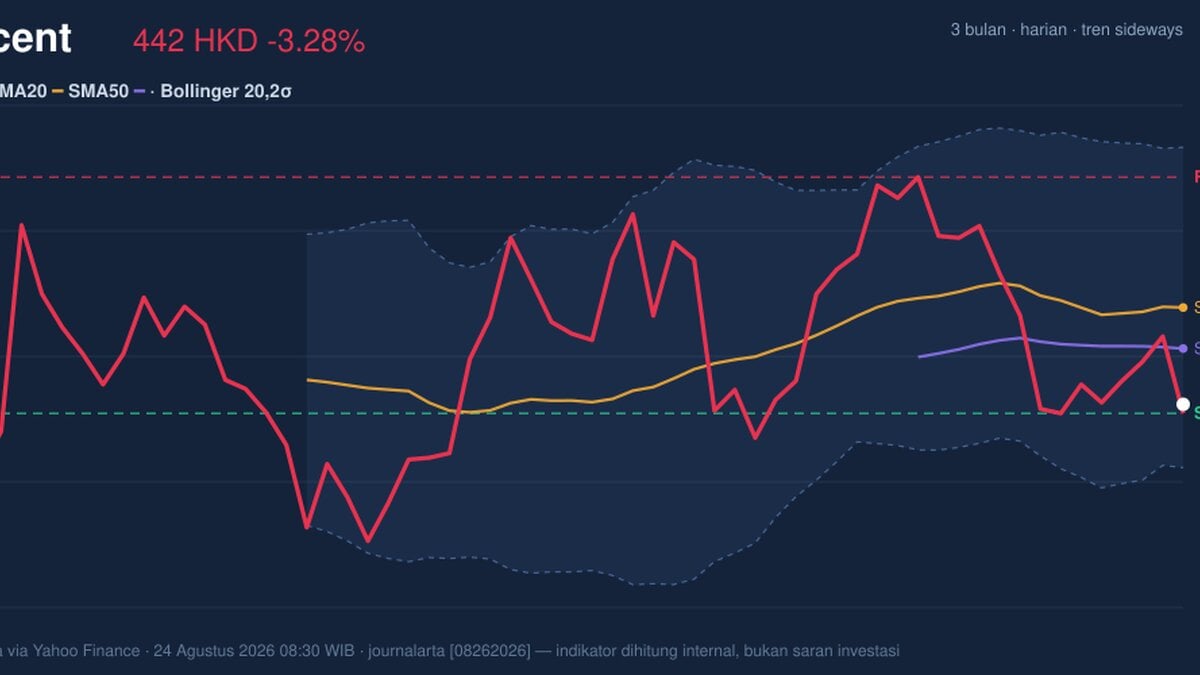
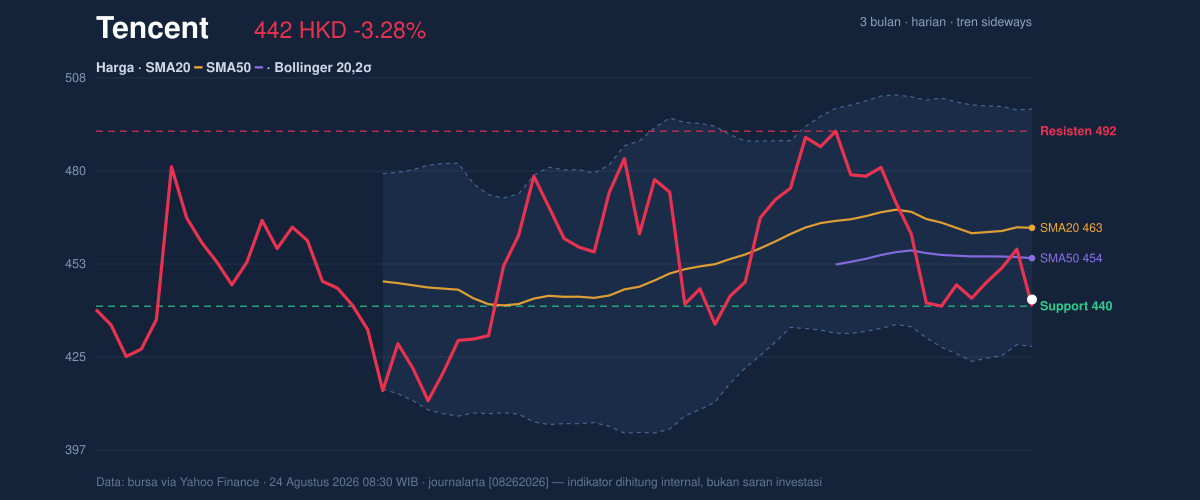
Tencent Holdings slid on HKEX on 24 August 2026, with 0700.HK last changing hands at HKD 442.00 after a 3.28% daily drop, as traders reacted to a break back below the short-term trend markers shown in the chart. The move matters less for the size of the decline than for what it says about positioning: Tencent is now trading below its SMA20 at 463.40 and below its SMA50 at 454.32, which usually means recent buying interest has been absorbed and the stock is no longer being carried by its near-term average price. The broader pattern remains sideways, but sideways markets can still be fragile when price slips toward the lower half of the range and momentum turns negative.
Trend & Price Action
The chart shows Tencent sitting in a weak spot within its recent structure. The stock is below the SMA20 and below the SMA50, yet there has been no fresh MA-cross, so this is not a clean trend reversal signal so much as a drift lower inside a range. The slope of the SMA20 is only 0.01% over 5 days, which tells readers that the average itself is almost flat; in plain English, the trend is not accelerating upward or downward, but price has still slipped under it. That combination often signals indecision rather than conviction, especially when the stock is only 4% from the 20-hour support at 440.00 and still well below the recent ceiling.
The range context is important. Tencent’s 3-month high is 497.80 and the 3-month low is 411.00, so the current level is closer to the lower half of that band than the top. The 20-hour resistance at 492.20 remains the first obvious barrier above, while the 20-hour support at 440.00 is now the level that matters most for short-term market confidence.
A flat trend is not the same as a stable one.
Oscillators & Momentum
The momentum tools in the chart lean more cautious than the price action alone. Tencent’s RSI at 42.4 is still technically neutral, which means the stock is not yet in a classic oversold or overbought condition. But the Stochastic %K at 6.5 and %D at 21.8 show a much sharper message: near-term momentum is oversold. For general readers, stochastic is a faster gauge of whether the latest price is stretched relative to its recent range; when it sinks this low, it often tells you the stock has been sold aggressively in the short run, even if the broader trend has not fully broken.
The deeper warning comes from MACD at -3.659, with the signal line at -0.655 and the histogram at -3.004. That setup means downside momentum is still dominating and has not yet shown a convincing turn. In practical terms, the stock can be oversold and still fall if sellers remain in control; the chart is showing exactly that kind of tension. The indicators are not aligned for an immediate rebound, but they do suggest that any further weakness may need fresh selling pressure rather than just passive drift.
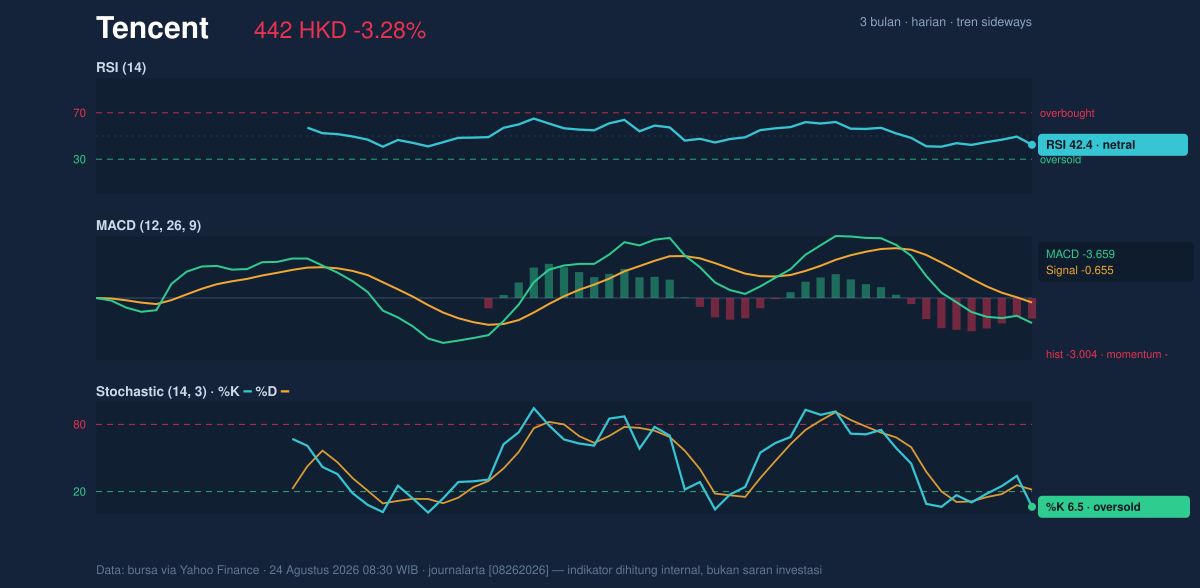
Momentum is stretched, but it has not yet broken back the other way.
Volatility & Volume
Tencent’s Bollinger bands help frame how far the stock has moved relative to its recent average. With the middle band at 463.40, the price is trading below the center line, and the %B at 20% shows it is sitting near the lower part of the band structure rather than near the middle. The lower band at 427.99 is now the next technical area that could catch attention if the current support gives way. Importantly, the band width of 15.3% is described as normal, not squeezed, which suggests the market is not in a coiled, pre-breakout state. In other words, there is room for movement, but no evidence yet of an imminent volatility expansion.
The volume picture is mixed. Last volume of 29,180,102 was only 1.1 times normal, so the decline was not driven by a dramatic surge in participation. That matters because heavy volume on a drop often signals conviction; here, the move looks more like steady distribution than panic. Still, OBV is falling, and that is the more important clue. On-balance volume tracks whether money flow is quietly building or leaking away; a declining OBV means sellers have had the upper hand over time, even if the latest session did not look exceptional on turnover alone.
Key Levels & Scenarios
The market is now orbiting a narrow technical corridor. 440.00 is the first line to watch, because it is both the 20-hour support and close to the current price. If that level fails, the chart opens toward the 427.99 lower Bollinger band, with the 411.00 three-month low acting as the deeper downside reference. On the upside, a recovery would need to reclaim the 463.40 SMA20 first; only then would the stock begin to repair the damage done by the recent slide. Above that, 492.20 resistance and then 497.80 mark the upper end of the recent range.
The signal is simple: Tencent is not in free fall, but it is not yet showing enough internal strength to call the dip complete.
Technical Verdict: HOLD (wait & see)
HOLD (wait & see)
- MACD remains negative, so downside momentum is still active.
- Price is below both SMA20 and SMA50, which keeps the short-term structure under pressure.
- Stochastic is oversold, but that is a warning of stretched selling, not proof of reversal.
Verdict invalidated if price breaks below 427.99, because that would push Tencent through the lower Bollinger band and signal a deeper loss of short-term support.
- Ideal Entry Range: 427.99 to 440.00
- Exit Target (Target Price): 463.40, then 492.20 if momentum improves
- Stop Loss protection: below 427.99, with deeper risk toward 411.00
Plain English: the stock looks stretched after the drop, but the chart has not yet proved that sellers are done.
“The market is telling us the floor is being tested, and what happens at 440 will decide whether this is just a pause or something more serious.”
Summary Data Tencent
| Last price | 442.00 HKD |
| Change 1 day / 5 days / 1 month | -3.28% / -0.99% / -0.23% |
| Trend / MA-cross | sideways / none |
| SMA20 / SMA50 | 463.40 / 454.32 |
| RSI (14) / Stochastic %K | 42.4 / 6.5 |
| Bollinger %B / ATR | 20% / 12.50 |
| Support / Resistance 20 days | 440.00 / 492.20 |
| Data as of | 24 Agustus 2026 08:30 WIB |
Track Tencent share price daily: live levels, support/resistance and our full Tencent analysis history.



