Testing Key Resistance, DBS Stock Gains 0.53% Today
On Agustus 26, 2026: price 76.40 SGD, trend uptrend, RSI 57.8, support 73.55, resistance 76.99. technical analysis of dbs stock. Testing Key Resistance — full…
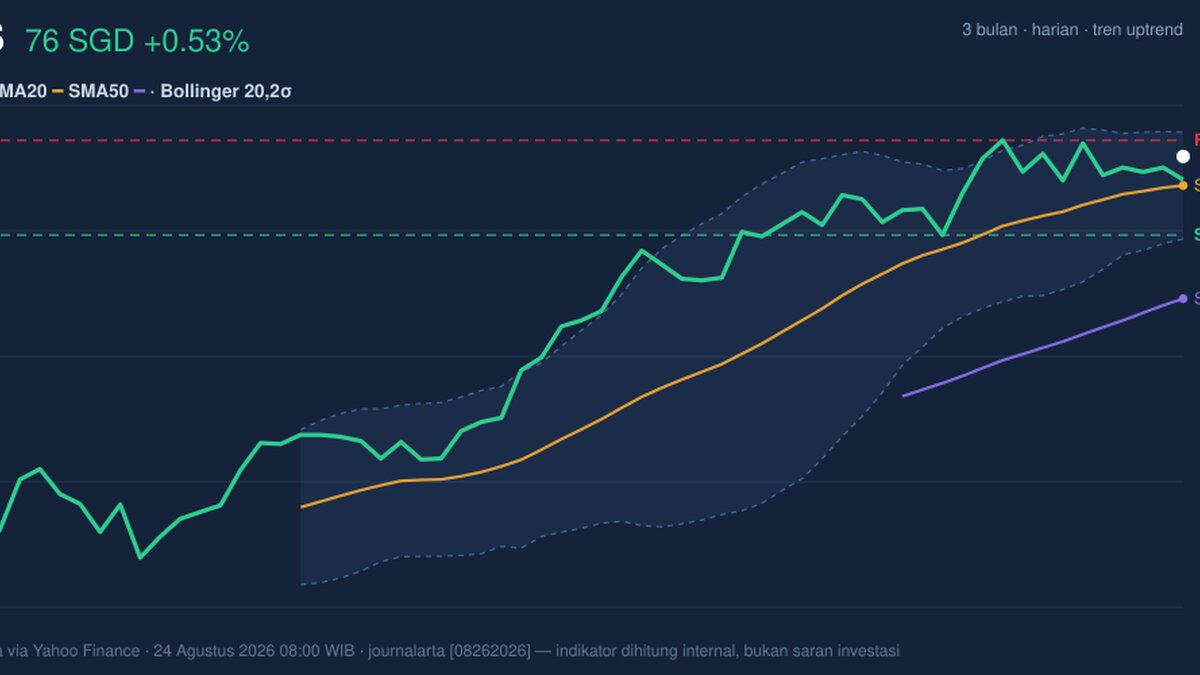
DBS Group’s SGD 76.40 close on SGX, up 0.53% from 76.00, leaves the Singapore lender still in an uptrend but not in full command of the tape. The share price is trading above the 20-day moving average at 75.35 and well above the 50-day average at 71.24, which keeps the broader structure constructive. But the latest signals are mixed: momentum has cooled, volume is thin, and the stock is sitting close to near-term resistance rather than breaking cleanly away from it.
Trend & Price Action
The chart shows a stock that is still climbing, but with less urgency than the trend line alone might suggest. The 20-day moving average is rising at 0.95% over five days, a sign that the short-term trend remains intact and that buyers have not lost control of the intermediate picture. The absence of a fresh MA-cross matters too: there is no new moving-average crossover to signal a stronger acceleration phase, so the move is better read as an ongoing trend rather than a fresh technical breakout.
Price position also matters. DBS is trading at 83% of its 20-hour range, which means it is near the top end of the recent band, but not yet through it. That is constructive, yet it also raises the bar for follow-through. The stock’s 3-month high of 77.97 is close enough to act as a visible ceiling, while the 3-month low of 61.60 frames the scale of the recovery already achieved.
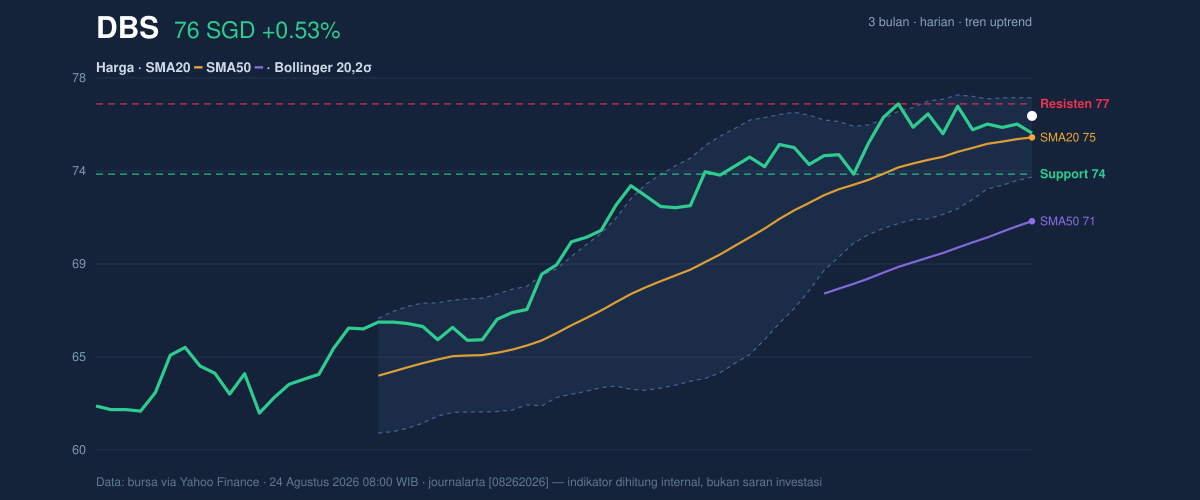
In plain terms, the chart says DBS is still leaning upward, but it now needs proof that buyers can push it beyond nearby supply.
Oscillators & Momentum
The momentum readings are the main reason to avoid reading too much into the positive trend. The RSI at 57.8 sits in neutral territory, which usually means the stock is neither stretched nor washed out. That is not a bearish reading by itself; it simply says there is room for movement in either direction. The Stochastic %K at 47.7 and %D at 52.9 are also neutral, showing that short-term price pressure has cooled after earlier strength.
The more important signal is the MACD at 1.309 versus signal at 1.600, with a histogram of -0.292. That negative histogram tells readers that upside momentum is currently weaker than the trend might imply. In practical terms, the stock is still above key averages, but the pace of ascent has slowed enough for the market to pause and reassess. That kind of divergence often shows up when a stock is consolidating before a bigger move — or when it is running out of steam near resistance.
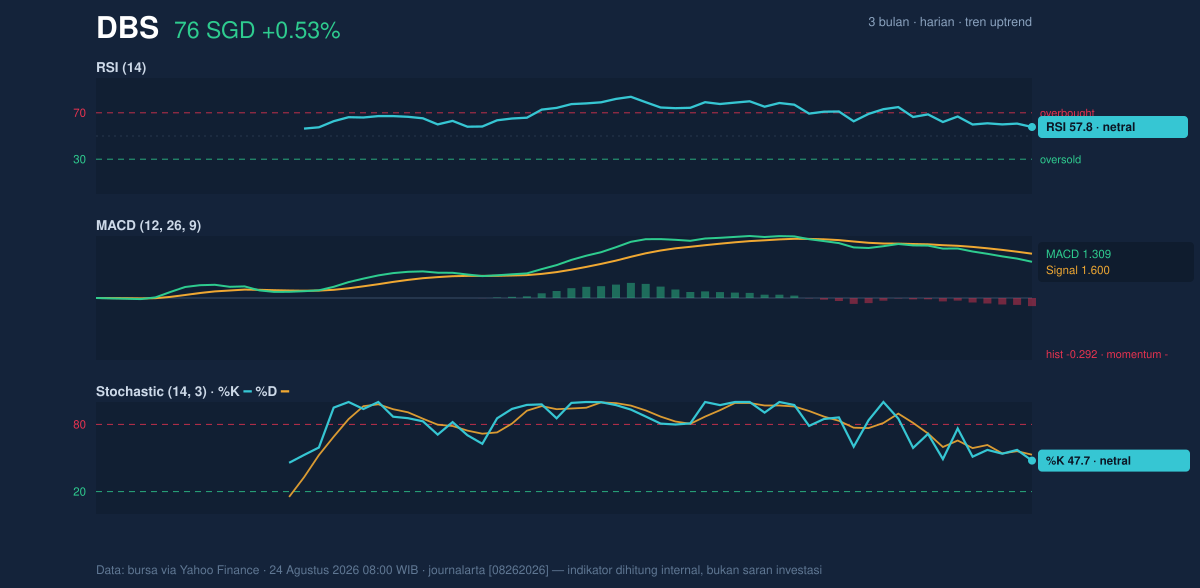
RSI neutral, Stochastic neutral, and MACD negative together form a mixed momentum profile rather than a clean bullish one.
Volatility & Volume
Volatility is not elevated, but it is also not dead. The ATR(14) of 1.34, equal to 1.8% of price, points to moderate daily movement. That is enough for the stock to travel meaningfully if a catalyst appears, but not so much that the chart looks unstable. The Bollinger Bands are more revealing: the upper band at 77.29, middle band at 75.35, and lower band at 73.40 show price hovering above the midline and within reach of the upper band, while the %B at 77% says DBS is trading in the upper part of its recent volatility envelope.
More important still, the 5.2% band width is narrowing. A squeeze usually means the market is compressing, which often precedes a larger move. The direction of that move is not guaranteed, but the setup tells traders that the current calm may not last. If the stock clears the top of the range, volatility could expand upward; if it slips back under the mid-band, the squeeze could resolve into a pullback instead.
Volume is not confirming a decisive breakout yet. Last trade volume of 2,455,200 was only about 0.5× the 20-day average of 4,633,639, which means participation was light. That matters because price advances built on weak turnover can fade quickly. Still, the OBV is rising, which suggests the longer-term balance of buying pressure has not broken down. In simple language: the tape is quiet, but not empty of support.
Key Levels & Scenarios
The nearest level to watch is the 20-hour resistance at 76.99. DBS is close enough to test it soon, but not far enough above it to claim a breakout. On the downside, the 20-hour support at 73.55 is the first level that would show whether buyers are still defending the recent trend. The Bollinger midline at 75.35 is also important because it doubles as the SMA20; losing that level would weaken the immediate tone, even if the broader trend remains intact above the SMA50 at 71.24.
If price pushes through 76.99 with stronger participation, the chart opens toward the 77.29 Bollinger upper band and then the 77.97 three-month high. If it fails to clear that area, the stock may continue to drift inside the squeeze, with the 75.35 midline acting as the first line of defense. A break below 73.55 would be more telling, as it would signal that the recent upward bias is losing traction.
Technical Verdict: HOLD (wait & see)
HOLD (wait & see) fits the current setup because the trend is still positive, but momentum and volume are not yet confirming a fresh advance. The price above SMA20 and SMA50 keeps the structure constructive; the negative MACD histogram warns that upside force has softened; and the Bollinger squeeze suggests a larger move may be building, but not yet resolved. The verdict is invalidated if price breaks below 73.55.
- Ideal Entry Range: 75.35 to 76.99, where the stock is near the SMA20/Bollinger midline and just under resistance.
- Exit Target: 77.29 to 77.97, aligned with the Bollinger upper band and the 3-month high.
- Stop Loss Protection: 73.55, the 20-hour support level.
For non-traders, this means DBS still looks technically healthy, but the chart is waiting for a stronger push before it shows its hand. “It’s not breaking down — it’s just not breaking out yet.”
Summary Data DBS
| Last price | 76.40 SGD |
| Change 1 day / 5 days / 1 month | 0.53% / -0.62% / 3.33% |
| Trend / MA-cross | uptrend / none |
| SMA20 / SMA50 | 75.35 / 71.24 |
| RSI (14) / Stochastic %K | 57.8 / 47.7 |
| Bollinger %B / ATR | 77% / 1.34 |
| Support / Resistance 20 days | 73.55 / 76.99 |
| Data as of | 24 Agustus 2026 08:00 WIB |
Track DBS share price daily: live levels, support/resistance and our full DBS analysis history.



