Testing Key Resistance, OCBC Stock Gains 1.65% Today
On Agustus 26, 2026: price 31.49 SGD, trend uptrend, RSI 64.4, support 28.63, resistance 31.79. technical analysis of ocbc stock. Testing Key Resistance — full…
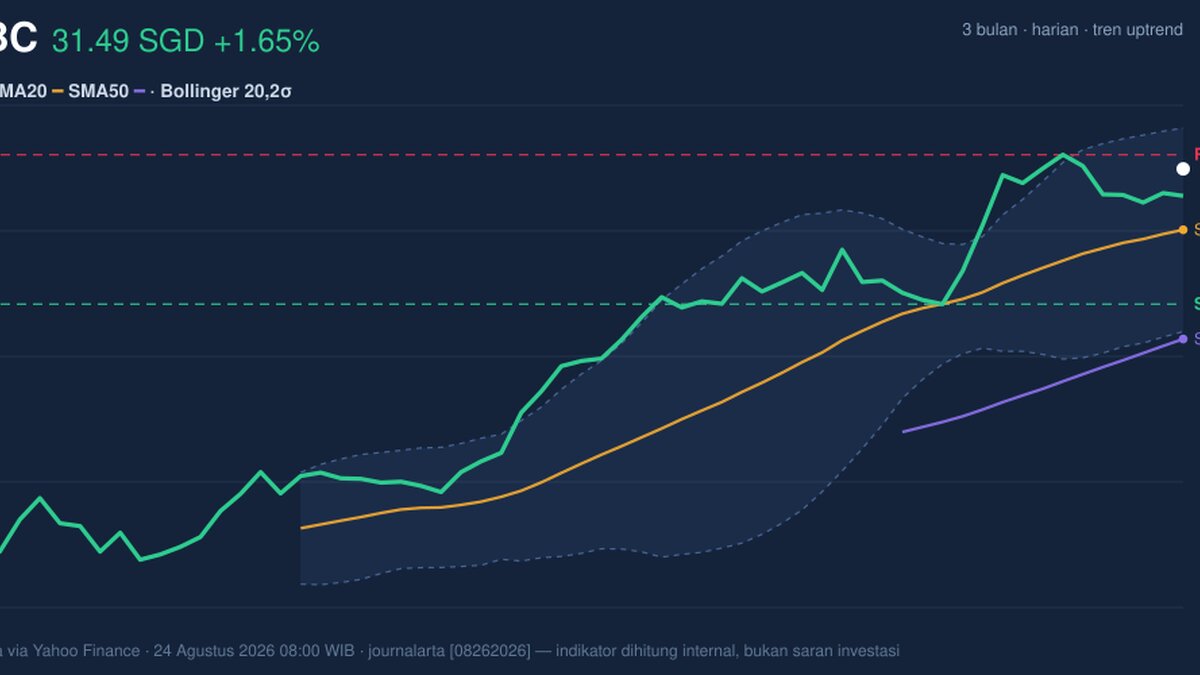
OCBC Bank’s shares on SGX rose to SGD 31.49 as of 24 August 2026 08:00 WIB, up 1.65% on the day, and the move keeps the stock anchored near the top of its recent trading band. The price is still above its medium-term trend markers, but the tape is sending a mixed message: the trend remains constructive, while momentum and participation are not fully confirming the advance.
Trend & Price Action
The broader structure is still positive. OCBC is trading above its SMA20 at SGD 30.20 and well above its SMA50 at SGD 27.90, which tells readers the stock has moved decisively above both its short- and medium-term averages. That usually signals that recent buyers have had the upper hand. The SMA20 is rising at 1.70% over five days, so the near-term trend is not flat; it is still tilting higher, as shown in the chart.
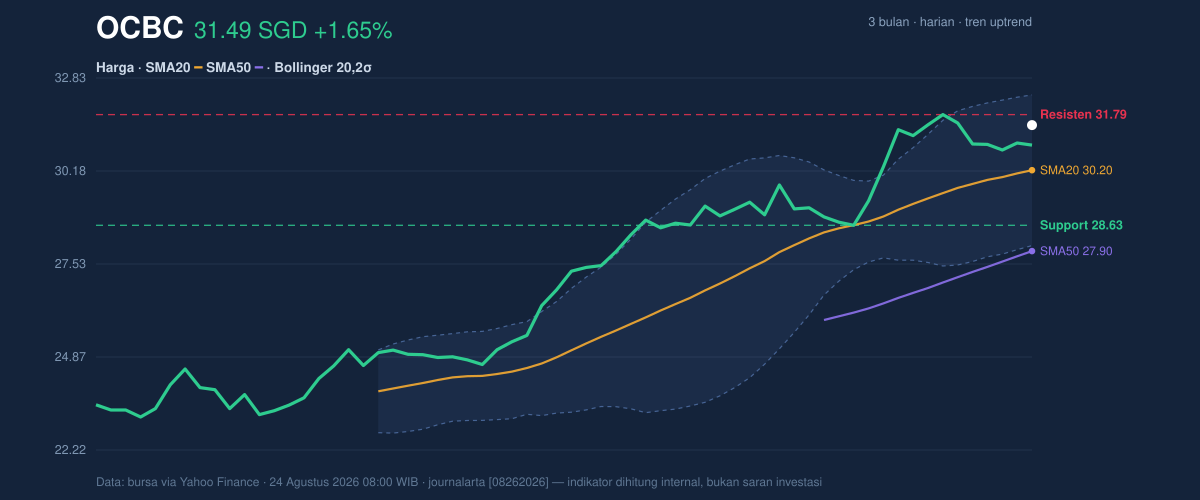
The current price sits at 91% of the 20-hour range, near the upper end of the SGD 28.63 to SGD 31.79 support-resistance corridor. That matters because strength near the top of a range can mean two very different things: either the stock is pressing into a breakout zone, or it is running into near-term resistance and becoming vulnerable to a pause. The stock is also close to its 3-month high of SGD 31.86, which reinforces the idea that the market is testing an important ceiling. A clean move through that area would signal that recent gains are no longer just a rebound, but a continuation of the broader uptrend.
Oscillators & Momentum
The momentum picture is less decisive than the price trend. The RSI at 64.4 is still described as neutral, though it is leaning toward the stronger end of the range. In plain terms, that suggests the stock is firm but not yet stretched enough to be called overbought. The Stochastic %K at 71.8 and %D at 71.0 are also neutral, but they are sitting near a level that often appears when a stock has already enjoyed a decent run. That does not imply an immediate reversal; it simply means upside may need fresh buying to continue.
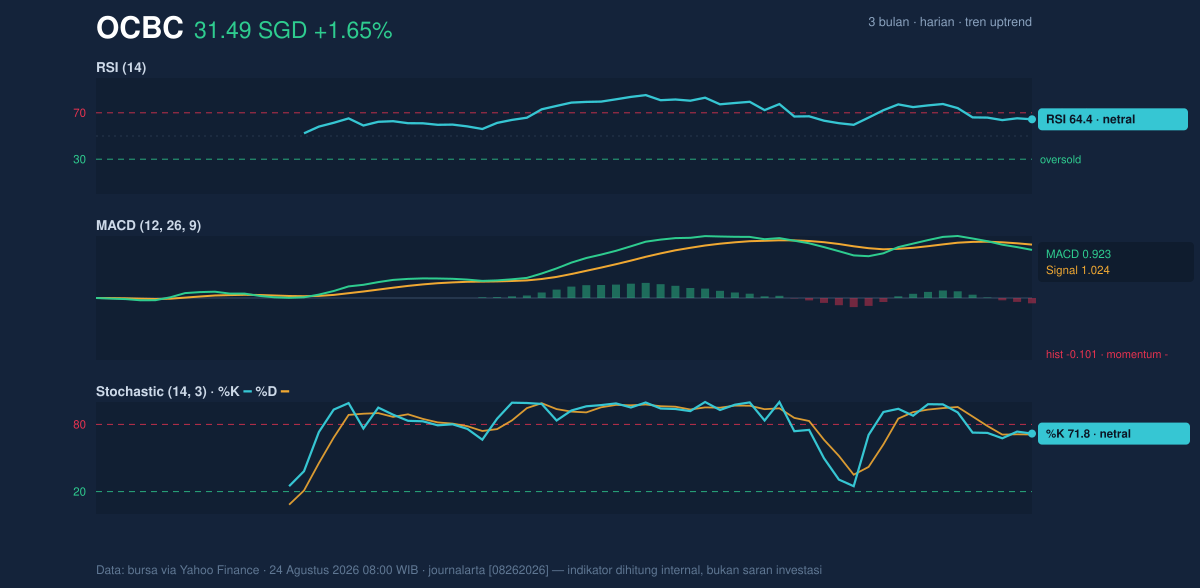
The more important caution comes from MACD. The MACD at 0.923 remains positive in absolute terms, but it is below the signal line at 1.024, leaving a histogram of -0.101. That negative histogram is the key signal here: it shows that the pace of upside momentum has slowed even while price is still holding up. In chart terms, the trend is intact, but the acceleration behind it has weakened. When that happens near resistance, traders often watch closely for either a fresh breakout or a short consolidation.
Volatility & Volume
Volatility is moderate rather than explosive. The ATR(14) of 0.67, equal to 2.1% of price, suggests the stock is capable of normal daily swings without indicating panic or a disorderly move. The Bollinger Bands add another useful layer. With price near the upper band at SGD 32.35, a middle band at SGD 30.20, and a lower band at SGD 28.05, the stock is trading with a %B of 80%. That means the price is closer to the top of its recent volatility envelope than the bottom. The 14.2% band width is described as normal, so this is not a squeeze that often precedes a sharp expansion; instead, it looks like an ordinary trending phase with room to move, but not much evidence yet of a volatility breakout.
Volume, however, is the soft spot in the setup. The latest turnover of 3,733,200 is only about 0.5x the 20-hour average of 6,966,119, which means the latest rise came on quieter-than-usual participation. That is important because price gains are more convincing when they are backed by heavier trading. The OBV is falling, which adds a second warning: on-balance volume tracks whether money is generally flowing into or out of a stock, and a decline here suggests the recent price lift has not yet been matched by broad accumulation.
Key Levels & Scenarios
The immediate map is straightforward. SGD 31.79 is the nearest resistance from the 20-hour range, and SGD 31.86 is the 3-month high that stands just above it. Those two levels are the obvious test for the current advance. If OCBC clears that zone, the chart would likely shift from “range-top pressure” to “breakout attempt.” On the downside, SGD 30.20 is the first important support because it is also the SMA20 and the Bollinger middle band. A move back below that line would signal that the short-term trend is losing traction. Below that, SGD 28.63 is the lower boundary of the recent range, and SGD 28.05 is the lower Bollinger band, a zone that would likely attract attention if momentum fades further.
The key signal to watch is whether price can defend the upper part of the band while momentum stabilizes. If it cannot, the current strength may simply be a late-stage push within an existing trend rather than the start of a stronger leg higher.
Technical Verdict: HOLD (wait & see)
HOLD (wait & see) fits the current setup because the trend is still upward, but momentum and volume are not fully confirming the move.
- Reason 1: Trend remains constructive — price is above the SMA20 at SGD 30.20 and SMA50 at SGD 27.90, with the SMA20 slope still rising.
- Reason 2: Momentum is mixed — RSI 64.4 and Stochastic 71.8 / 71.0 are firm but not decisive, while the MACD histogram at -0.101 shows fading acceleration.
- Reason 3: Participation is weak — volume is only 0.5x the 20-hour average and OBV is falling, which reduces confidence in the latest push.
- Invalidation condition: this verdict is invalidated if price falls below SGD 30.20, the key short-term trend and Bollinger midline support.
- Ideal Entry Range: SGD 30.20 to SGD 31.49, with the lower end offering trend support and the upper end reflecting current trade levels.
- Exit Target: SGD 31.79 to SGD 31.86, where near-term resistance meets the 3-month high.
- Stop Loss protection: below SGD 28.63, with SGD 28.05 as the deeper technical backstop.
In plain English: the stock still looks firm, but it needs stronger volume and a cleaner momentum turn before the move can be trusted.
Summary Data OCBC
| Last price | 31.49 SGD |
| Change 1 day / 5 days / 1 month | 1.65% / -0.19% / 8.25% |
| Trend / MA-cross | uptrend / none |
| SMA20 / SMA50 | 30.20 / 27.90 |
| RSI (14) / Stochastic %K | 64.4 / 71.8 |
| Bollinger %B / ATR | 80% / 0.67 |
| Support / Resistance 20 days | 28.63 / 31.79 |
| Data as of | 24 Agustus 2026 08:00 WIB |
Track OCBC share price daily: live levels, support/resistance and our full OCBC analysis history.



