UOB Stock Analysis: Gains 1.43%, Momentum Weakens
On Agustus 26, 2026: price 41.11 SGD, trend sideways, RSI 38.6, support 40.22, resistance 43.89. technical analysis of uob stock. UOB Stock Analysis — full…
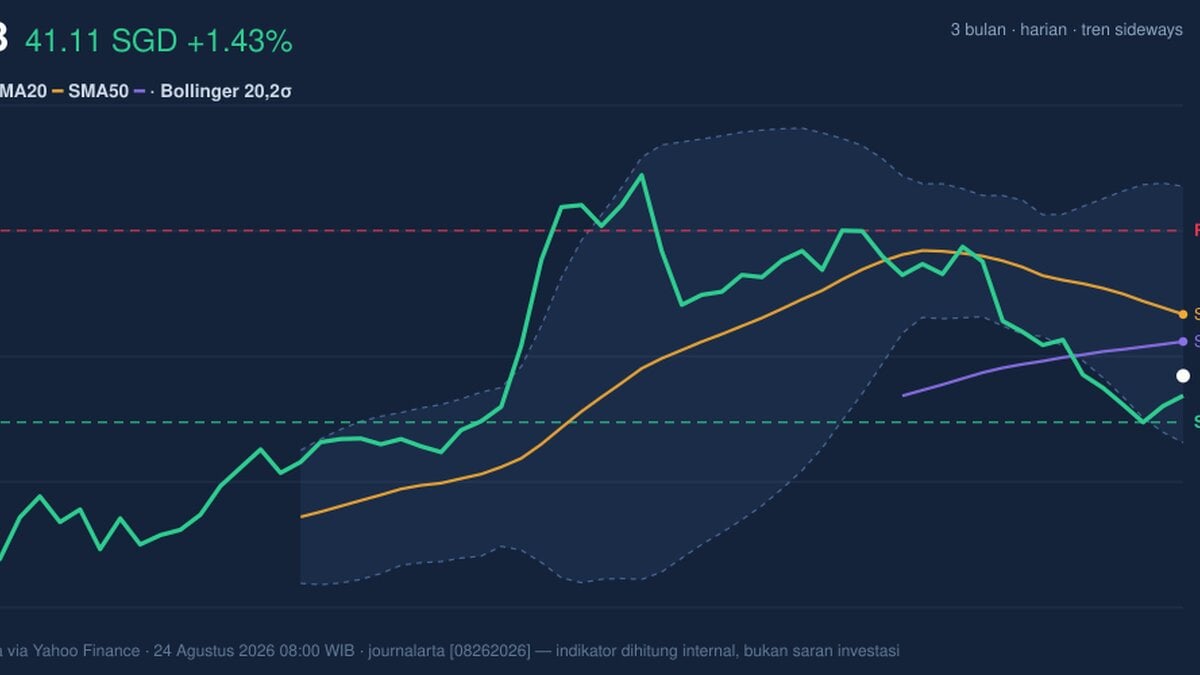
United Overseas Bank (UOB) traded at SGD 41.11 on SGX on 24 August 2026, up from the previous close of 40.53, but the move sits inside a broader patch of weakness rather than a fresh uptrend. The shares are still trading below SMA20 at 42.29 and below SMA50 at 41.77, which matters because price under both short- and medium-term averages usually signals that rallies are meeting supply before they can turn into a sustained advance. The stock is also in a sideways trend, yet the slope of SMA20 at -1.38% over 5 days shows that the short-term drift is still leaning down. In plain terms, UOB is not breaking down sharply, but it is also not reclaiming enough ground to suggest buyers have fully regained control.
Trend & Price Action
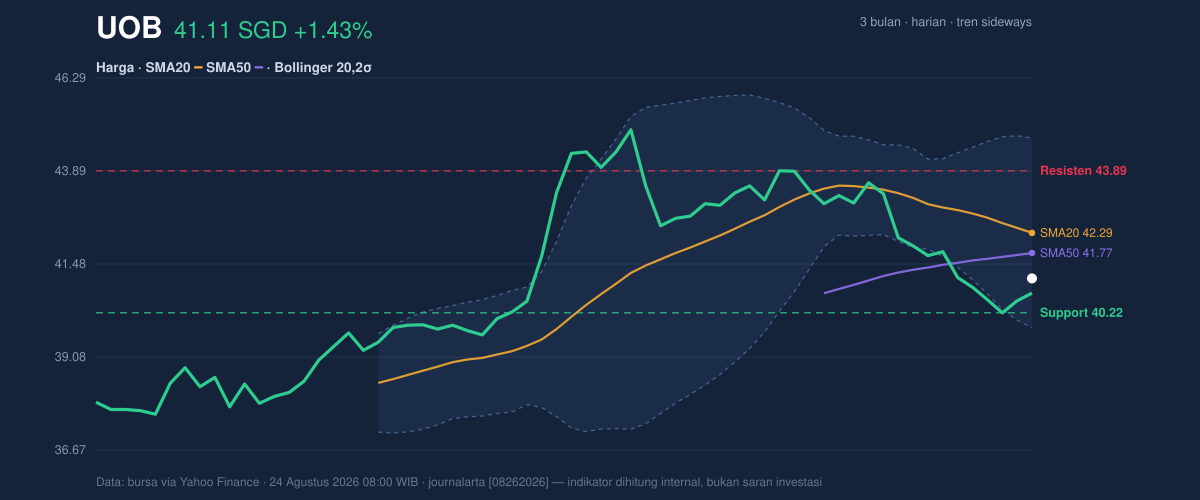
The chart shows price sitting in the lower half of its recent band, with UOB at 24% of the 20-hour range between support and resistance. That position is important because it tells us the latest bounce has not yet recovered the area where momentum usually improves. The stock is also closer to the lower Bollinger band than the upper one, with %B at 26%; that means price is travelling near the lower edge of its recent statistical range, often a sign that the market is still discounting the name rather than re-rating it. The Bollinger width of 11.6% is normal, so this is not a volatility squeeze that typically precedes a sharp breakout. Instead, it suggests a regular trading environment where the next move will likely need stronger participation to matter.
The broader range gives the same message. UOB is trading below the 3-month high of 45.15 and above the 3-month low of 37.52, which places it in the middle-lower part of its recent envelope. That is not a crisis, but it does show that the stock has room to fall before it reaches the prior floor, while still needing to clear several layers of resistance before a more convincing recovery can be claimed.
Oscillators & Momentum
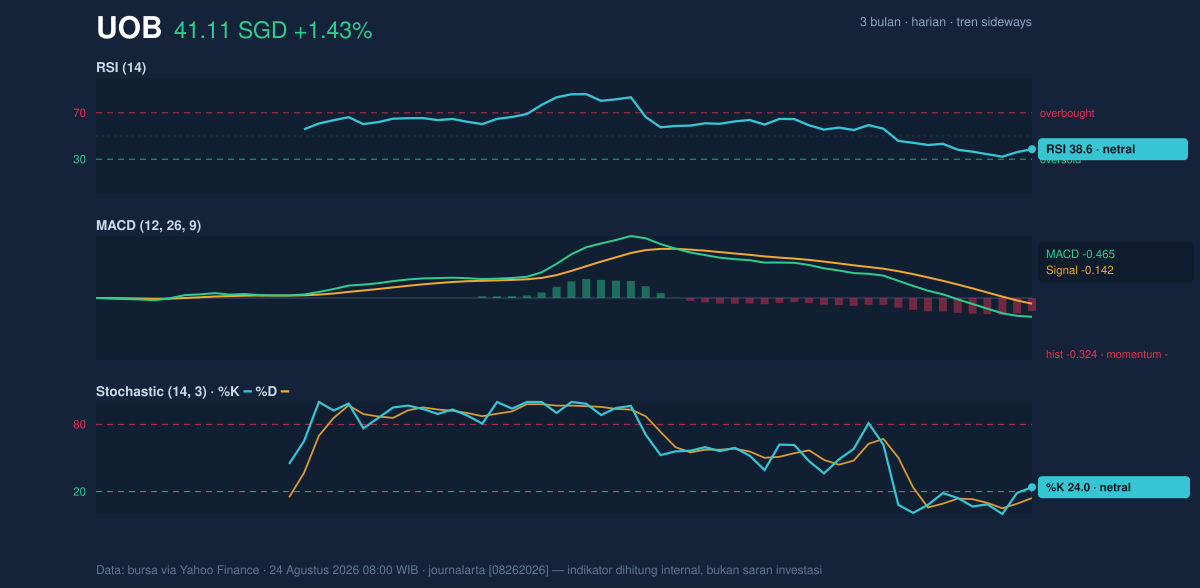
Momentum indicators are mixed, but the balance still tilts cautious. RSI at 38.6 is technically neutral, yet it sits below the midpoint that often separates healthy momentum from defensive trading. Stochastic %K at 24.0 and %D at 14.3 also point to a market that is still near the lower end of its recent range, though not yet in a decisive oversold reversal pattern. The key detail is the MACD at -0.465, below the signal line at -0.142, with a negative histogram of -0.324. That configuration means downside momentum is still stronger than the rebound attempt, even if the pace of decline is not necessarily accelerating.
This is the kind of setup that often produces choppy trading rather than a clean trend change. RSI and Stochastic are not screaming exhaustion, which means the stock has not reached a classic panic low. But MACD remains negative, so the chart is still asking for proof that buyers can sustain follow-through rather than just stage one-day rebounds.
Volatility & Volume
Volatility is present, but not extreme. ATR at 0.68, or 1.7% of price, indicates moderate daily movement; that is enough for meaningful swings, but not enough to imply disorderly trading. The more telling signal is participation. Last volume was 2,957,500, below the 20-day average of 3,762,767, or about 0.8x normal. When price rises on lighter volume, the move often lacks conviction. That matters here because UOB’s one-day gain has not yet been backed by broad market engagement.
The OBV is down, and that weakens the case for accumulation. OBV, or on-balance volume, is a running measure of whether volume is flowing into up days or down days; when it declines while price tries to stabilise, it suggests sellers have been more forceful over time than the headline price change alone implies. In other words, the latest bounce has not yet been confirmed by the market’s internal tape.
Key Levels & Scenarios
The immediate map is clear. Support is 40.22, while resistance is 43.89. Those levels frame the current debate better than the daily percentage change does. If UOB can reclaim the upper end of that range, it would show that the stock is moving out of the lower-band zone and back toward the center of its trend structure. If it fails to hold support, the chart risks revisiting the lower part of the 3-month range near 37.52.
For now, the price is still below the Bollinger middle band at 42.29, which doubles as the SMA20, so the first test is whether the stock can get back above that area and stay there. That would be a sign that the recent bounce is becoming more than just a reflex move. Until then, the market is treating UOB as a stock in repair mode, not one in a confirmed recovery.
Technical Verdict: HOLD (wait & see)
HOLD (wait & see)
- MACD remains negative and below the signal line, showing momentum is still weak despite the day’s rebound.
- Price is below SMA20 and SMA50, which means the stock has not yet reclaimed the key short- and medium-term trend markers.
- Volume is only 0.8x normal and OBV is down, so the latest rise lacks strong participation.
Invalidation condition: this verdict is invalidated if price falls below 40.22, because that would break immediate support and expose the lower range.
- Ideal Entry Range: 40.22 to 42.29
- Exit Target: 43.89
- Stop Loss Protection: below 40.22
In plain English, the chart says UOB is stabilising, but it has not yet shown enough strength to confirm a clean turnaround.
Summary Data UOB
| Last price | 41.11 SGD |
| Change 1 day / 5 days / 1 month | 1.43% / -0.05% / -5.10% |
| Trend / MA-cross | sideways / none |
| SMA20 / SMA50 | 42.29 / 41.77 |
| RSI (14) / Stochastic %K | 38.6 / 24.0 |
| Bollinger %B / ATR | 26% / 0.68 |
| Support / Resistance 20 days | 40.22 / 43.89 |
| Data as of | 24 Agustus 2026 08:00 WIB |
Track UOB share price daily: live levels, support/resistance and our full UOB analysis history.



