Visa Stock Technicals Today: Gains 0.45%, RSI Overbought
On Agustus 26, 2026: price 384.14 USD, trend uptrend, RSI 70.2, support 358.84, resistance 384.14. technical analysis of visa stock. Visa Stock Technicals —…
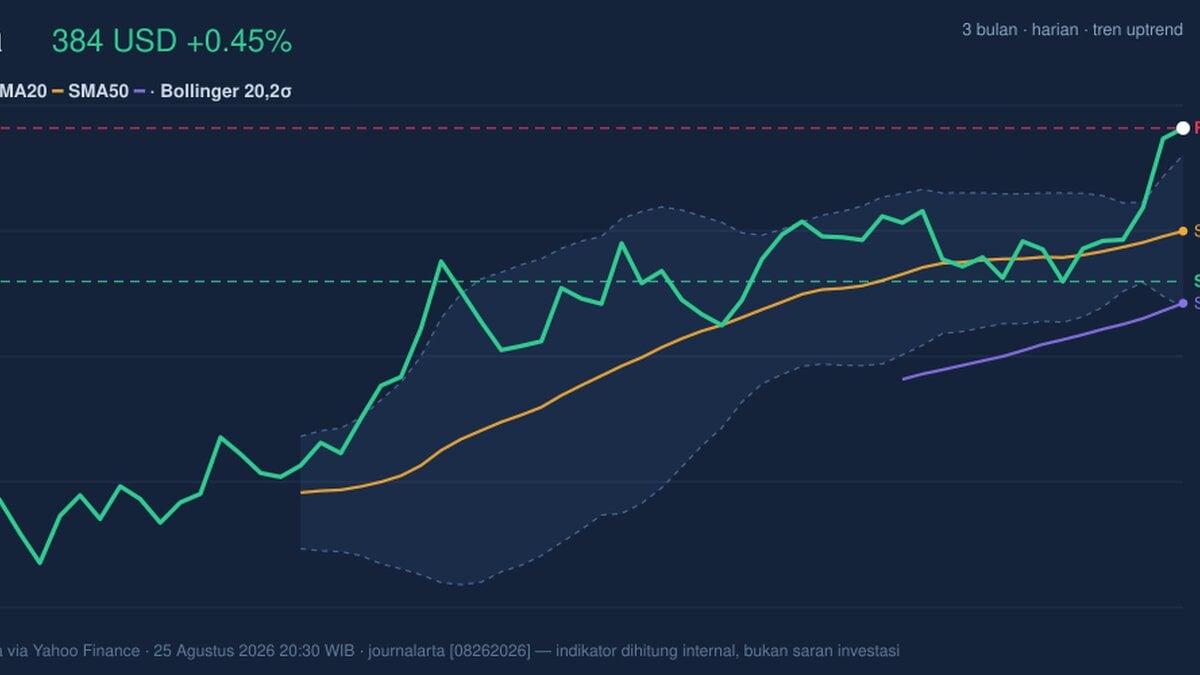
Visa’s shares on the NYSE edged up to 384.14 USD, a fresh push that leaves the stock essentially at the top of its recent trading range, according to Yahoo Finance data cited at 25 August 2026 20:30 WIB. The move is not dramatic in percentage terms, but it matters because the price is now pressing against the upper boundary of its 3-month high at 384.20. In plain terms, the market is telling investors that buyers are still in control, even after a strong run.
Trend & Price Action
The broader structure remains constructive. Visa is in an uptrend, and the stock is trading well above both the SMA20 at 367.15 and the SMA50 at 355.25. That positioning usually signals that short-term and medium-term traders are still paying higher prices, not lower ones. The SMA20 slope of 1.09% over 5 days reinforces that the trend is not just drifting sideways; it is still rising.
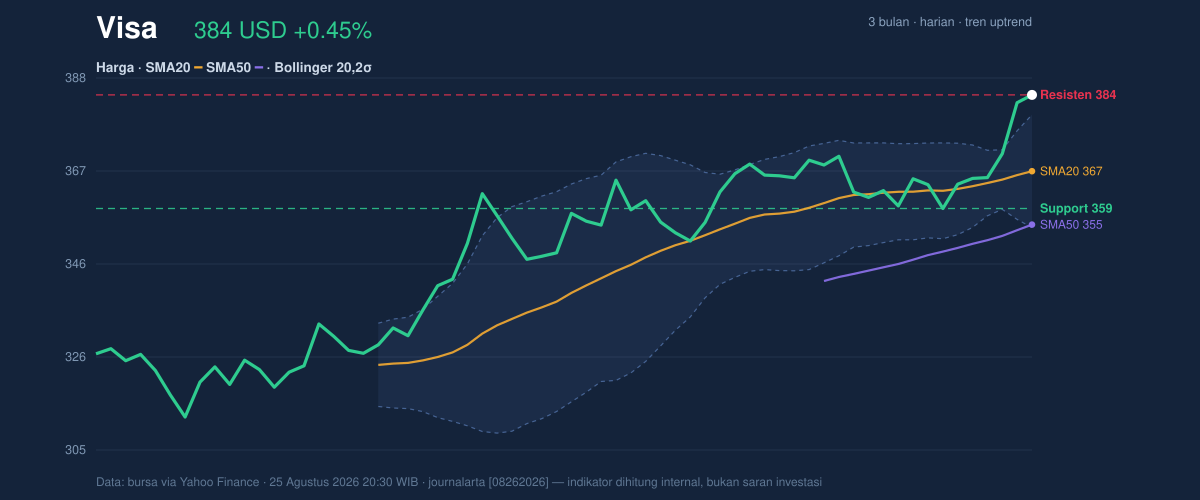
The absence of a new MA-cross matters here. A fresh moving-average crossover often marks a change in trend, but Visa does not need one to validate the current move because price is already above both key averages. More important is the way the stock is behaving at the top of its range: the 20-hour support at 358.84 sits well below spot, while the 20-hour resistance at 384.14 has effectively been tested and matched. That means the market is no longer exploring lower levels; it is trying to decide whether there is enough demand to step into new territory.
The chart also shows a tighter setup beneath the surface. Bollinger Bands are narrowing, which often means volatility has compressed before a larger move. In practical terms, a squeeze does not predict direction, but it does warn that the current calm can give way to a sharper swing.
Oscillators & Momentum
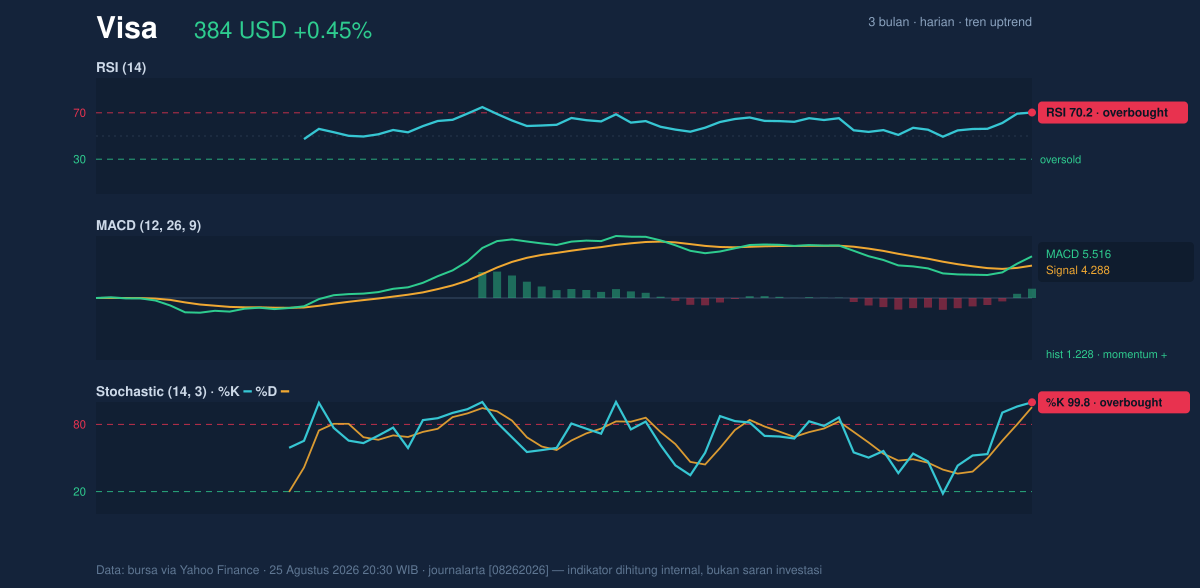
Momentum is strong, but it is also stretched. The RSI at 70.2 and Stochastic %K at 99.8 / %D at 95.4 both sit in overbought territory. For general readers, that does not mean the stock must fall; it means the pace of buying has been fast enough that the market may be vulnerable to pauses, consolidation, or brief pullbacks. When oscillators are this elevated, they often describe enthusiasm rather than safety.
That said, the momentum picture is not turning negative. The MACD at 5.516 remains above its signal line at 4.288, and the histogram at 1.228 shows the bullish spread is still positive. MACD is useful because it measures whether trend strength is improving or fading, and here it is still confirming upward pressure. So the message from momentum is mixed but not contradictory: the stock is extended, yet the trend has not broken.
Volatility & Volume
The volatility backdrop is moderate. Visa’s ATR of 6.39, equal to 1.7% of price, suggests the stock is not swinging wildly from day to day. That matters because a breakout from a compressed Bollinger setup can be more orderly when ATR is contained rather than explosive. The 6.8% Bollinger bandwidth also points to a squeeze, which is often the market’s way of storing energy before a directional move.
Volume adds a second layer of confirmation. The latest print of 6,777,600 shares is below the 20-hour average of 7,253,460, or about 0.9× normal. On its own, that suggests the latest advance was not powered by unusually heavy participation. But OBV is rising, which means cumulative volume flow still favors buyers. That combination is important: the stock is advancing without a surge in turnover, yet the longer-term volume balance remains supportive. In other words, there is demand, but not a clear stampede.
Key Levels & Scenarios
The most immediate level to watch is the 384.14 resistance, which is also the current price and sits just under the 3-month high of 384.20. A clean move above that zone would place the stock into uncharted near-term territory within this dataset, and the squeeze in Bollinger Bands suggests such a move could unfold quickly if it happens. If the stock fails to hold this area, the first meaningful reference point is the 20-hour support at 358.84. Below that, the SMA20 at 367.15 becomes the more important trend guide, because a loss of that average would show the recent momentum is losing its footing.
The signal to watch is not just whether Visa is high, but whether it can stay high without momentum cooling too sharply. Overbought readings can persist in strong trends, yet they also make the stock more sensitive to disappointment. That is why the current setup is best read as powerful but extended.
Technical Verdict: HOLD (wait & see)
HOLD (wait & see)
- RSI at 70.2 and Stochastic at 99.8 / 95.4 show the stock is overbought, which raises the risk of a pause after the recent climb.
- MACD remains positive with the histogram still above zero, so the trend has not rolled over.
- Bollinger Bands are squeezing, which often precedes a larger move, but direction is not yet confirmed.
Verdict invalidated if price falls below 358.84.
- Ideal Entry Range: 367.15 to 358.84
- Exit Target: 384.20
- Stop Loss protection: below 355.25
For non-traders, that means Visa still looks strong, but the stock is stretched enough that the next move matters more than the last one.
“The market is still paying up for the trend, but it is also asking whether this strength can keep going without a breather.”
Summary Data Visa
| Last price | 384.14 USD |
| Change 1 day / 5 days / 1 month | 0.45% / 5.46% / 4.79% |
| Trend / MA-cross | uptrend / none |
| SMA20 / SMA50 | 367.15 / 355.25 |
| RSI (14) / Stochastic %K | 70.2 / 99.8 |
| Bollinger %B / ATR | 118% / 6.39 |
| Support / Resistance 20 days | 358.84 / 384.14 |
| Data as of | 25 Agustus 2026 20:30 WIB |
Track Visa stock price daily: live levels, support/resistance and our full Visa analysis history.



