LLY Momentum Weakens: Stock Drops 3.59% (Agustus 27, 2026)
On Agustus 27, 2026: price 1,189.41 USD, trend sideways, RSI 47.7, support 1,115.68, resistance 1,280.34. technical analysis of lly stock.
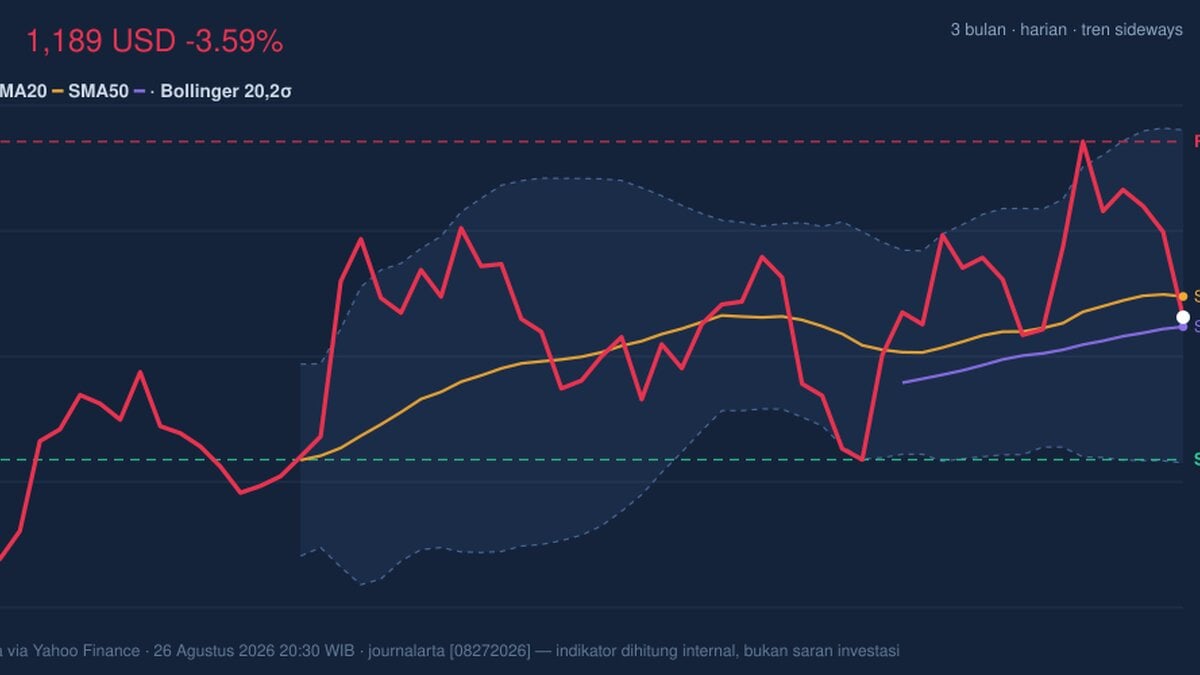
Eli Lilly shares fell to 1,189.41 on the NYSE, down 3.59% from the previous close of 1,233.66, and the move matters less as a single-day drop than as a test of where the stock is trading inside a broader, still-developing range. As shown in the chart, the price is sitting below the SMA20 at 1,200.19 but above the SMA50 at 1,184.52, a positioning that usually signals a market that has not broken down decisively, yet is losing short-term upward momentum. The stock is also trading in the middle of its recent band, with the latest print at roughly 45% of the 20-day range, which suggests neither buyers nor sellers have seized control.
Trend & Price Action
The broader setup is still best described as sideways, and that word is doing real work here. A sideways trend means the shares are not trending strongly enough for momentum traders to claim a clean directional move, but they are also not collapsing through support in a way that would indicate full-scale distribution. The SMA20 slope of 0.67% over five days points to a modestly rising short-term average, yet the fact that price is now beneath it shows the market is slipping under the line that had been acting as a near-term guide.
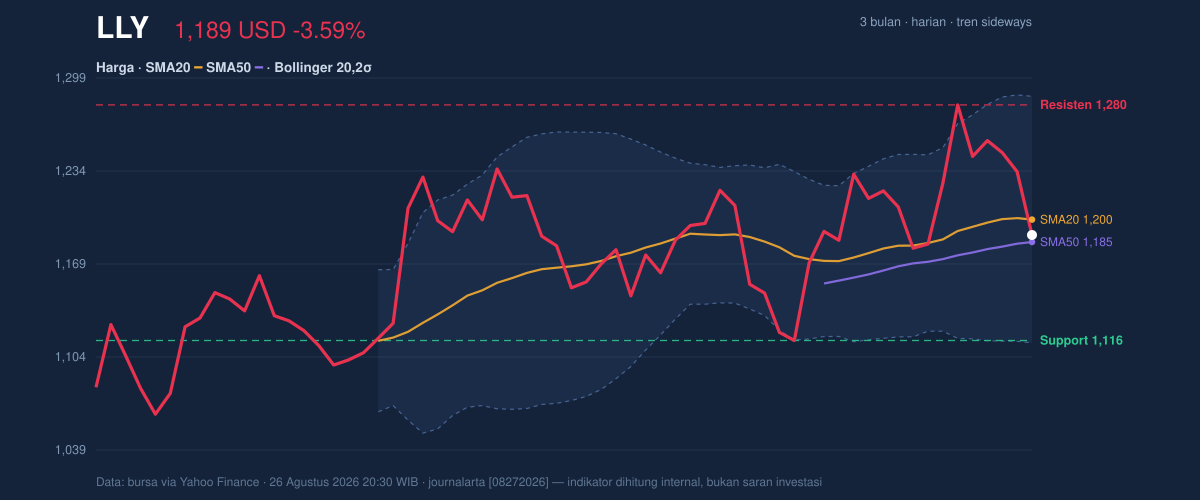
The Bollinger Bands help frame how much room the stock has to move before the market starts to look stretched. With the upper band at 1,286.37, the middle band at 1,200.19, and the lower band at 1,114.01, Lilly is hovering near the center of a normal-width channel. That matters because a normal band width of 14.4% does not point to a squeeze, or a market coiling for a violent breakout; it points to a stock that is moving, but not under unusual pressure. The recent 1-month decline of 1.70% and 5-day drop of 7.10% show that sellers have had the more immediate edge, even if the longer structure remains contained between the 3-month low of 1,052.15 and the 3-month high of 1,292.65.
Oscillators & Momentum
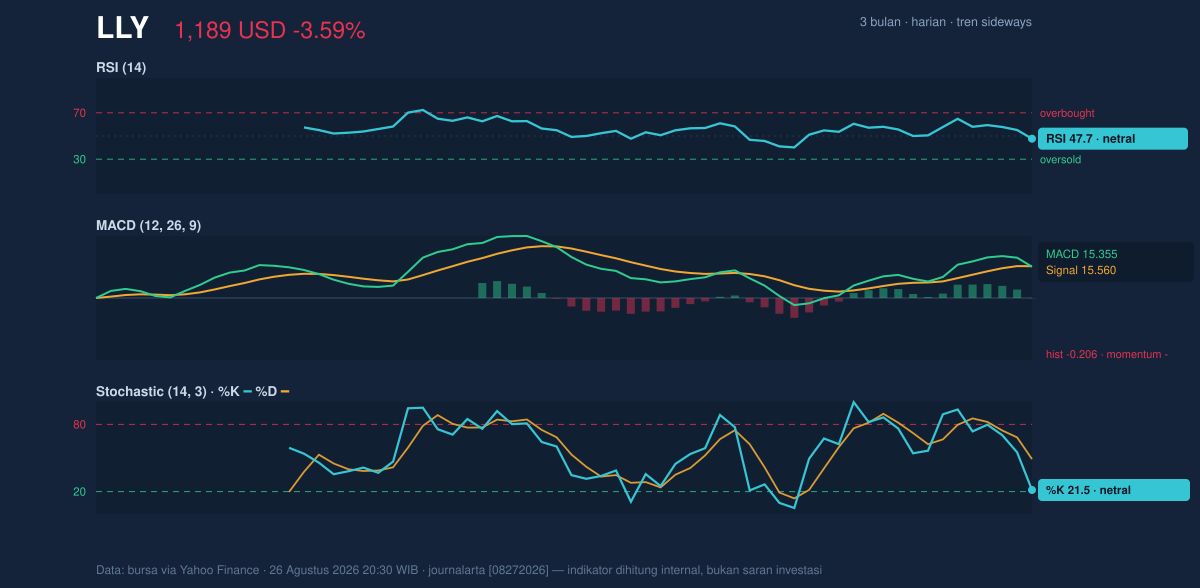
The momentum picture is softer than the price structure. The RSI at 47.7 is neutral, which usually means the stock is neither overbought nor oversold and is waiting for a catalyst or follow-through. That neutrality is important because it tells readers the recent drop has not yet pushed the shares into a technically exhausted condition. In plain terms, the market is not screaming “oversold rebound,” but it is also not flashing a warning that the stock has run too far too fast.
The Stochastic oscillator is more revealing. With %K at 21.5 and %D at 49.0, the short-term line is sitting low relative to its signal line, which often indicates fading upward momentum and a market that has lost its immediate bid. The MACD at 15.355 sits below the signal line at 15.560, and the histogram at -0.206 confirms that momentum has turned negative. As shown in the chart, that combination usually means price is still holding a range, but the internal push behind it is weakening. It is not a crash signal. It is a warning that buyers are no longer pressing as confidently as they were.
Volatility & Volume
Volatility is present, but not extreme. The ATR(14) of 40.46, equal to 3.4% of price, suggests a normal trading environment where daily swings can still be meaningful without implying panic conditions. This is useful context around the latest decline: the move is large enough to matter, but not so large that it automatically changes the stock’s long-term technical identity.
Volume adds an important layer. The latest turnover of 3,000,500 shares is only about 1.0x normal versus the 20-day average of 2,888,070, so the drop was not accompanied by a dramatic surge in participation. That usually weakens the argument that the move was a capitulation event. At the same time, OBV is falling, which means the balance of cumulative volume has been tilting away from the stock. When price is soft and OBV is down, the market is quietly telling us that distribution has been more persistent than accumulation, even if it has not become disorderly.
Key Levels & Scenarios
The nearest technical floor is 1,115.68 in 20-day support, almost directly aligned with the lower Bollinger band at 1,114.01. That overlap matters because when a support level and a volatility band converge, the area tends to become more important: if price reaches it, traders will watch closely to see whether the stock stabilizes or slips through. On the upside, 1,280.34 is the key resistance, sitting just under the 3-month high of 1,292.65. A move back above that zone would signal that the recent weakness has been absorbed and that the stock is revisiting the top of its range.
If the shares remain below 1,200.19, the SMA20, the message is one of continued short-term caution. If they fall through 1,115.68, the technical picture would deteriorate more clearly because the stock would be breaking a level that has so far contained the range. If instead price reclaims 1,200.19 and then presses toward 1,280.34, the chart would shift from defensive to constructive without needing a dramatic shift in fundamentals.
Technical Verdict: HOLD (wait & see)
HOLD (wait & see)
- RSI 47.7 is neutral, so the stock is not oversold enough to imply a technical rebound, but not weak enough to confirm a breakdown.
- MACD is below its signal line and the histogram is negative, showing momentum has slipped even while the broader range remains intact.
- Price is below the SMA20 but still above the SMA50, which is classic range-bound behavior rather than a clean trend reversal.
- Verdict invalidated if price breaks below 1,115.68.
- Ideal Entry Range: 1,115.68 to 1,184.52
- Exit Target: 1,280.34
- Stop Loss protection: below 1,114.01
In plain English: the chart says Lilly is not broken, but it has lost enough short-term strength that patience looks more sensible than urgency.
“Right now, the market is asking whether this is just a pause — or the start of something harder.”
Summary Data LLY
| Last price | 1,189.41 USD |
| Change 1 day / 5 days / 1 month | -3.59% / -7.10% / -1.70% |
| Trend / MA-cross | sideways / none |
| SMA20 / SMA50 | 1,200.19 / 1,184.52 |
| RSI (14) / Stochastic %K | 47.7 / 21.5 |
| Bollinger %B / ATR | 44% / 40.46 |
| Support / Resistance 20 days | 1,115.68 / 1,280.34 |
| Data as of | 26 Agustus 2026 20:30 WIB |
Track LLY stock price daily: live levels, support/resistance and our full LLY analysis history.