DBS Stock Drops 0.66%, Testing Support Level In Focus
On October 9, 2026: price 73.36 SGD, trend sideways, RSI 31.3, support 73.36, resistance 78.56. technical analysis of dbs stock. DBS Stock Drops — full details…
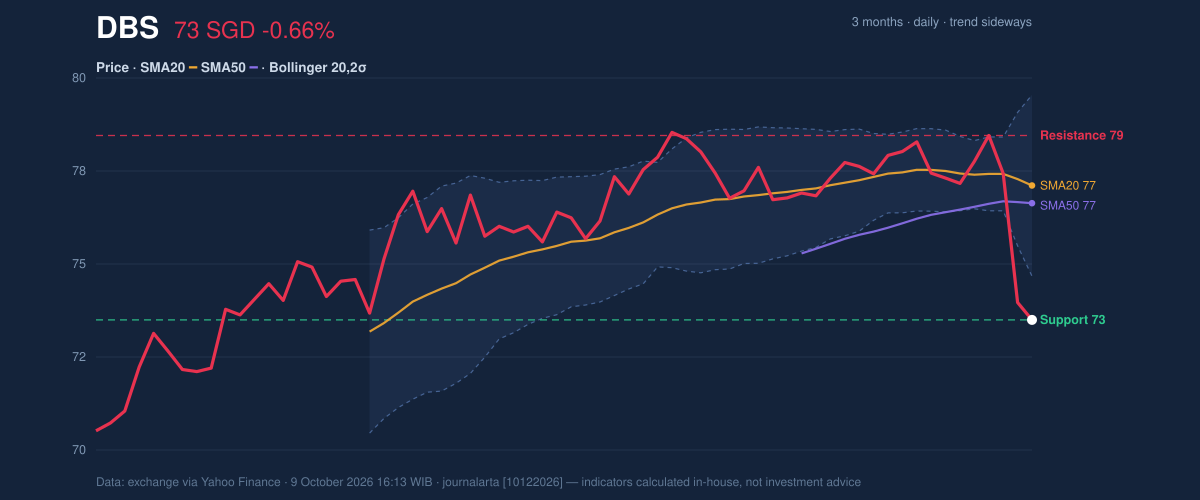
DBS Group fell 0.66% to S$73.36 on 9 October, closing at its lowest level in the past 20 trading days as turnover reached twice its 20-day average. The combination matters: the move came with unusually heavy participation just as the bank’s narrowing Bollinger Bands began to give way, suggesting pressure has turned into a more consequential test of support. The price data are from the exchange via Yahoo Finance.
Why DBS is in focus today
- Volume at 2.0× the 20-day average
- Closed at a 20-day low (73.36)
- Breaking out of a Bollinger squeeze (band width 6.6%)
Selected automatically from 16 SGX (Singapore) stocks by a technical-signal score with daily weighted randomisation — not a recommendation.
Trend & Price Action
The shares are below both the 20-day simple moving average (SMA) at S$77.15 and the 50-day SMA at S$76.65. The 20-day average is also falling, down 0.44% over five days. That places the near-term price structure on the weak side, although the broader trend is classified as sideways and there has been no new moving-average cross to confirm a longer-lasting shift.
DBS has lost 4.99% over five days and 4.73% over one month. It sits at the bottom of its 20-day range, with S$73.36 as support and S$78.56 as resistance. The three-month range, from S$69.40 to S$79.05, shows that the latest decline has not yet reached the period low—but the immediate support test is clear.
The price has slipped below the lower Bollinger Band, at S$74.59, while the band width has narrowed to 6.6%. A squeeze means recent price swings have contracted; a move out of that tight range can signal an increase in volatility. Here, the downside break and heavy volume make the move harder to dismiss as a quiet drift. As shown in the chart, price is below the moving averages and the lower band.
Oscillators & Momentum
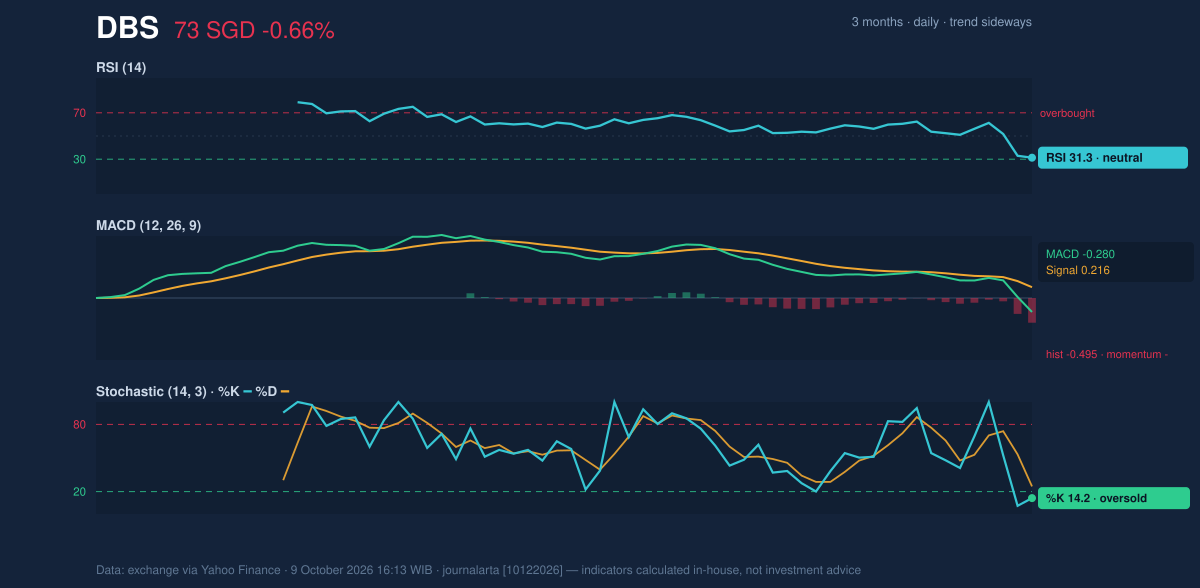
Momentum indicators are weak, but they do not all tell the same story. The RSI is 31.3, labelled neutral in the supplied data, placing it near the level commonly associated with an oversold market without confirming one by that classification. The Stochastic readings are more emphatic: %K at 14.2 and %D at 24.6 are oversold. Such readings can occur during a sharp decline; alone, they do not establish that a rebound has begun.
The MACD reinforces the downside signal. MACD is -0.280, below its 0.216 signal line, with a negative histogram of -0.495. In plain terms, downward momentum is still dominant. The contrast between oversold Stochastic readings and negative MACD leaves a key question: whether selling pressure is easing, or simply extending. The chart brings those signals together.
Volatility, Volume & Scenarios
Volume of 9,705,521 shares was 2.0 times the 20-day average of 4,975,630. That surge confirms broad participation in the decline, while falling On-Balance Volume (OBV)—a measure that tracks whether volume is accumulating on rising or falling days—offers no sign of buyers absorbing the pressure. Average True Range (ATR), a measure of typical price movement, is S$1.23, or 1.7% of the share price, indicating moderate volatility.
If DBS holds S$73.36, oversold Stochastic readings leave room for a recovery attempt towards the moving-average area and the S$78.56 resistance. A sustained move above resistance would be needed to challenge the current weak structure. If support fails, the three-month low of S$69.40 becomes the next reference point in the supplied data. Neither scenario is confirmed.
Technical Verdict: HOLD (wait & see)
Core conclusion: HOLD (wait & see) is the clearest technical reading while price tests support and momentum remains negative. This is a chart-based verdict, not an investment recommendation.
- Reasons: price is below the 20- and 50-day SMAs; MACD remains negative; and the 2.0-times volume surge alongside falling OBV confirms selling pressure. Oversold Stochastic readings are a counter-signal, but not yet a reversal.
- Invalidation: this verdict is invalidated if price falls below S$73.36, the stated 20-day support.
- Illustrative entry range: S$73.36–S$74.59, bounded by support and the lower Bollinger Band.
- Illustrative exit target: S$78.56, the stated 20-day resistance.
- Illustrative stop-loss protection: below S$73.36, where the support-based scenario fails.
For non-traders, the chart says DBS is weak but already stretched enough that the next move at support matters more than any single oversold reading.
The next technical test is whether S$73.36 holds; the latest close put that level directly in focus.
Summary Data DBS
| Last price | 73.36 SGD |
| Change 1 day / 5 days / 1 month | -0.66% / -4.99% / -4.73% |
| Trend / MA-cross | sideways / none |
| SMA20 / SMA50 | 77.15 / 76.65 |
| RSI (14) / Stochastic %K | 31.3 / 14.2 |
| Bollinger %B / ATR | -24% / 1.23 |
| Support / Resistance 20 days | 73.36 / 78.56 |
| Data as of | 9 October 2026 16:13 WIB |
Disclaimer: This technical analysis is generated automatically from exchange data (via Yahoo Finance) and indicators calculated by JournalArta, for information and education only. The verdict and the entry, target and stop-loss levels are not investment advice or a solicitation to buy or sell any security. Investment decisions and their risks rest solely with the reader.
Track DBS share price daily: live levels, support/resistance and our full DBS analysis history.