ANTA Stock Analysis: Gains 1.18%, Momentum Gains
On October 9, 2026: price 72.65 HKD, trend sideways, RSI 48.4, support 71.20, resistance 74.15. technical analysis of anta stock. ANTA Stock Analysis — full…
Why ANTA is in focus today
- MACD histogram has just turned positive
Selected automatically from 16 HKEX (Hong Kong) stocks by a technical-signal score with daily weighted randomisation — not a recommendation.
Trend & Price Action
ANTA is trading just above its 20-day simple moving average, or SMA20, at HK$72.40, but remains below its 50-day average of HK$73.96. The shorter average’s slope is negative, down 0.89% over five days, and there has been no recent moving-average crossover. Together, those readings point to consolidation rather than a confirmed change in trend: buyers have kept the share price above its shorter-term average, but the longer-term measure remains overhead. The stock sits around the midpoint of its recent range, with support at HK$71.20 and resistance at HK$74.15 over the past 20 trading days. Its three-month high and low are HK$80.90 and HK$70.30, respectively. As shown in the chart, the current price is near the Bollinger middle band and has room to move in either direction before reaching the indicated range boundaries.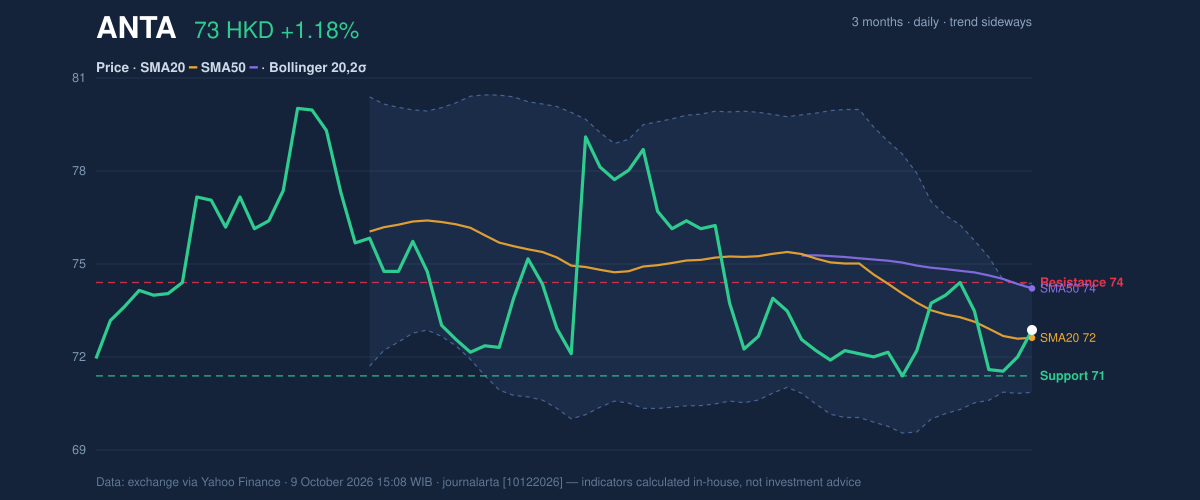
Oscillators & Momentum
The momentum picture is improving, but not decisively bullish. MACD, a measure comparing short- and longer-term price momentum, remains below zero at -0.512, yet its histogram has turned positive at 0.047, edging above the signal line at -0.559. That is the selected signal to watch: momentum has begun to strengthen, although it has not crossed into positive territory overall. RSI is neutral at 48.4, indicating neither unusually strong buying nor selling pressure. The stochastic readings—%K at 51.6 and %D at 35.9—are also neutral, with the faster line above the slower one. That supports the idea of a short-term lift, but the indicators do not yet show a strong or broad-based momentum confirmation.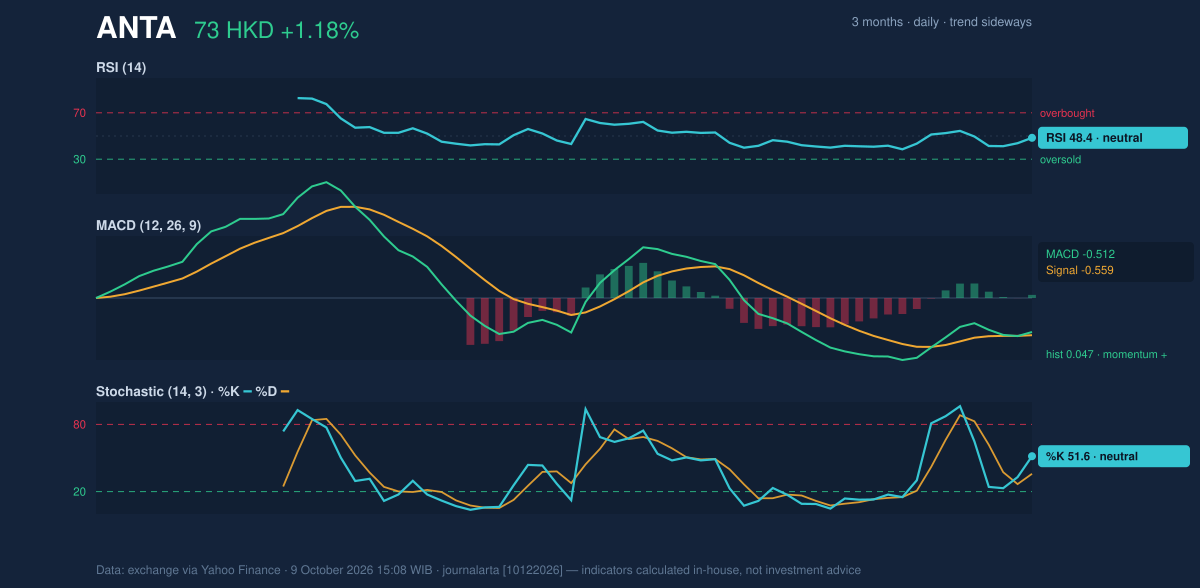
Volatility & Volume
The Bollinger bands, which track price relative to recent volatility, are narrowing. Their width is 4.8%, and the price is at 57% of the distance between the lower and upper bands—near the middle, not pressed against either edge. The squeeze can precede a larger move, but it does not identify the direction. The upper band at HK$74.13 is close to 20-day resistance at HK$74.15; a move through that area would provide a clearer test of whether the MACD improvement can translate into a breakout. Volatility is moderate: the average true range, a measure of typical daily movement, is HK$1.63, or 2.2% of the share price. Volume reached 7.77 million shares, about 1.2 times its 20-day average, while on-balance volume rose. That combination suggests the latest advance had more participation than a typical session, though one stronger-volume day is not enough to establish sustained accumulation.Key Levels & Scenarios
A sustained move above HK$74.15 would clear the nearby resistance and upper Bollinger band, strengthening the case that the positive MACD histogram is part of a broader recovery. If the shares fail there, the first support to monitor is HK$71.20; a break below it would weaken the immediate setup and bring the three-month low of HK$70.30 into focus. Those are conditional scenarios, not predictions.Technical Verdict: HOLD (wait & see)
The indicators present mixed evidence: the positive MACD histogram and rising OBV are constructive, but the falling SMA20 slope, price below the SMA50, and neutral RSI leave the trend unconfirmed. The verdict is invalidated if the price falls below HK$71.20, the stated 20-trading-day support.- Ideal entry range: HK$71.20–HK$72.40, using support and the SMA20 as reference levels.
- Exit target: HK$74.15, the 20-trading-day resistance and nearby upper Bollinger band.
- Stop-loss protection: HK$70.30, the three-month low.
Summary Data ANTA
| Last price | 72.65 HKD |
| Change 1 day / 5 days / 1 month | 1.18% / -2.02% / 0.83% |
| Trend / MA-cross | sideways / none |
| SMA20 / SMA50 | 72.40 / 73.96 |
| RSI (14) / Stochastic %K | 48.4 / 51.6 |
| Bollinger %B / ATR | 57% / 1.63 |
| Support / Resistance 20 days | 71.20 / 74.15 |
| Data as of | 9 October 2026 15:08 WIB |
Disclaimer: This technical analysis is generated automatically from exchange data (via Yahoo Finance) and indicators calculated by JournalArta, for information and education only. The verdict and the entry, target and stop-loss levels are not investment advice or a solicitation to buy or sell any security. Investment decisions and their risks rest solely with the reader.
Track ANTA share price daily: live levels, support/resistance and our full ANTA analysis history.