Sembcorp Stock Gains 1.37%, Death Cross Pressure In Focus
On October 9, 2026: price 5.90 SGD, trend sideways, RSI 49.7, support 5.79, resistance 6.05. technical analysis of sembcorp stock. Sembcorp Stock Gains — full…
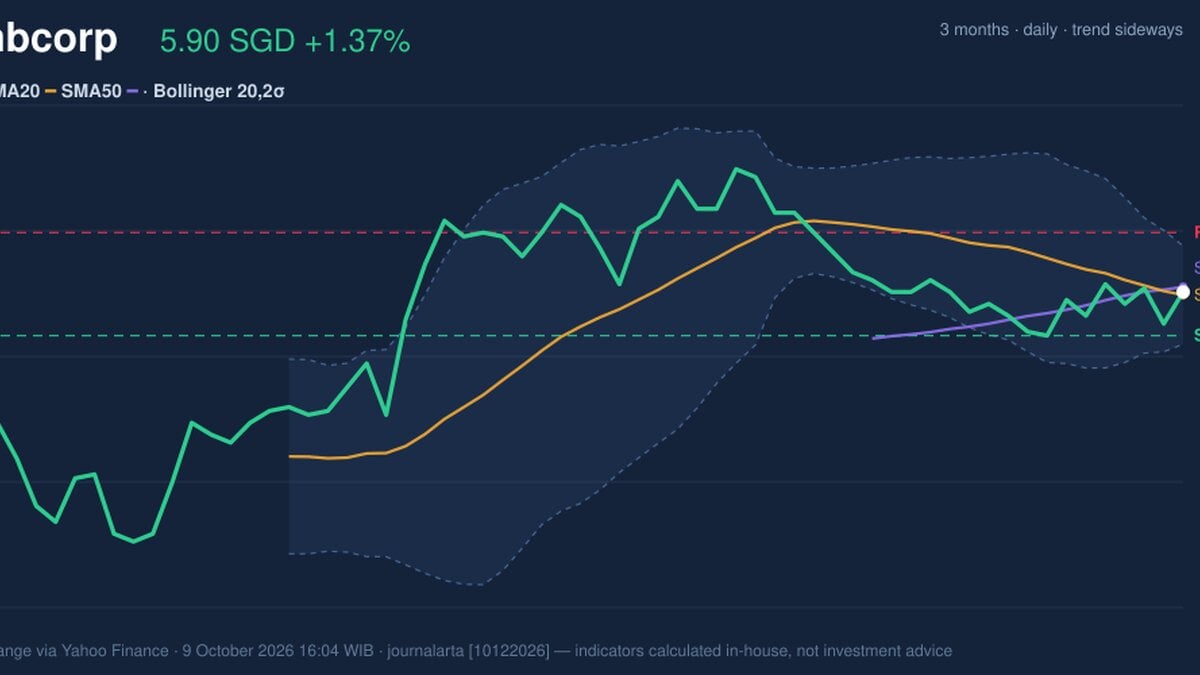
Why Sembcorp is in focus today
- Fresh death cross: SMA20 crossed below SMA50
- Not covered by JournalArta in the last 14 days
Selected automatically from 16 SGX (Singapore) stocks by a technical-signal score with daily weighted randomisation — not a recommendation.
Trend & Price Action
Sembcorp’s latest gain followed a 1.03% rise over five trading days, but the share remained down 3.28% over one month. That mixed picture fits a sideways trend: the short-term bounce has not yet reversed the broader monthly pullback. At S$5.90, the price is marginally above SMA20 at S$5.89 and close to SMA50 at S$5.91. However, the SMA20’s 1.08% decline over five days and the new death cross show that the shorter-term average has slipped beneath the longer-term one—a warning about trend direction, not proof that a deeper fall is inevitable. The share is at 42% of its 20-day range, between support at S$5.79 and resistance at S$6.05. Its three-month high and low are S$6.22 and S$5.22, respectively, placing the current price away from either extreme. As shown in the chart, the narrow gap between price and both moving averages leaves nearby levels important for judging whether the recent rise can gather traction.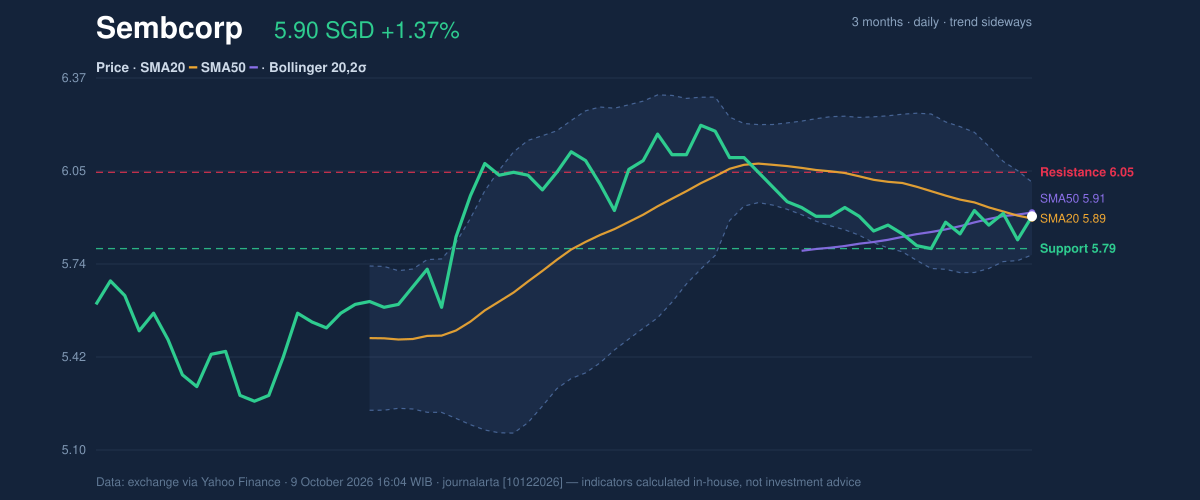
Oscillators & Momentum
Momentum readings are mixed rather than decisively bearish. The RSI is neutral at 49.7, close to the midpoint that generally separates stronger from weaker momentum. Stochastic %K at 66.7 is above %D at 56.9, suggesting recent buying has improved the short-term reading, but both remain classified as neutral. The MACD remains negative: at -0.021, it is below its -0.018 signal line, while the histogram is -0.003. In plain terms, downward momentum still has a slight edge, even as the price has risen over five days. That lack of alignment matters: the positive short-term move has not yet been confirmed by the MACD, while the neutral RSI and Stochastic do not indicate an oversold condition that would, by themselves, signal a strong rebound setup.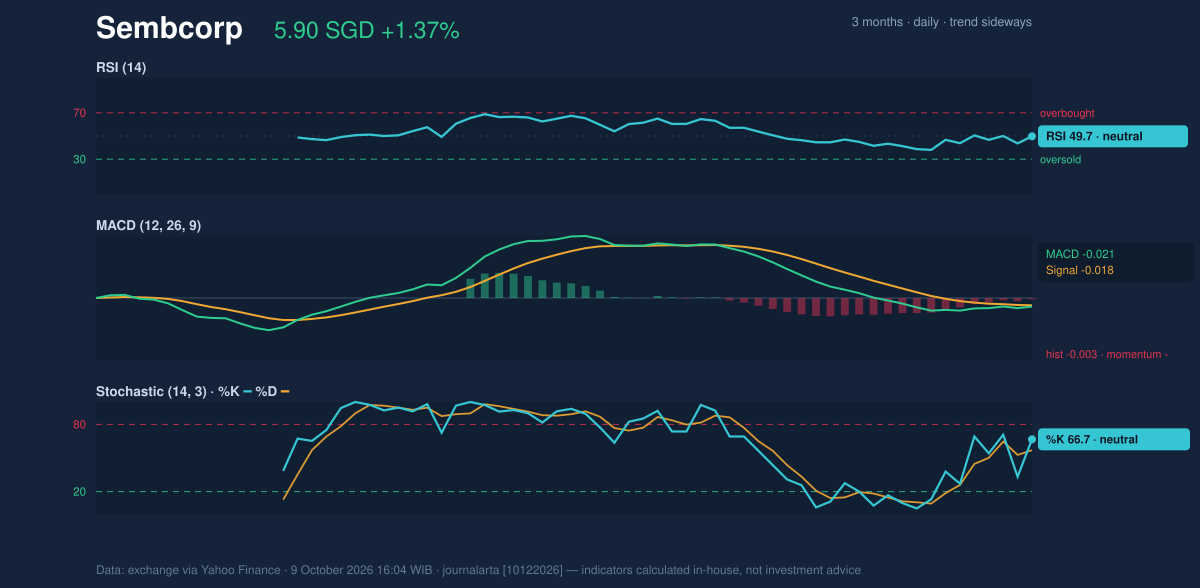
Volatility & Volume
The Bollinger Bands have narrowed to a 4.2% width, a squeeze that signals compressed recent price movement and the possibility of a larger move if trading breaks out of the range. It does not predict which way that move will go. The share’s position at 53% of the band, just above the middle line at S$5.89, is broadly balanced; the upper band is S$6.02 and the lower band S$5.77. The squeeze is a volatility warning, not a directional signal. ATR is S$0.10, equivalent to 1.8% of the share price, indicating moderate daily price variation in this dataset. Volume was 3,788,400 shares, or 0.9 times the 20-day average of 4,295,883, while OBV was falling. The session’s advance therefore came on below-average participation, and the declining OBV—an indicator that tracks whether volume is flowing more into or out of a share—does not yet confirm broad accumulation.Key Levels & Scenarios
The immediate test is whether Sembcorp can hold above S$5.79 support and retake the area around its moving averages. A sustained move through S$6.05 resistance would challenge the sideways structure and place the S$6.02 upper Bollinger Band within reach, though the resistance level itself remains the key reference. If support gives way, the lower Bollinger Band at S$5.77 is the next nearby technical marker. These are conditional scenarios, not forecasts.Technical Verdict: HOLD (wait & see)
The neutral verdict reflects a market without a clear directional confirmation. The death cross and negative MACD argue for caution, while the price’s position just above SMA20 and neutral RSI leave room for the share to stabilise rather than extend its decline. A narrowing Bollinger squeeze could precede a breakout, but below-average volume and falling OBV weaken the case that the recent bounce is already supported by stronger participation. - Ideal Entry Range: S$5.79–S$5.89, using 20-day support and SMA20 as reference levels. - Exit Target (Target Price): S$6.05, the 20-day resistance level. - Stop Loss: S$5.77, the lower Bollinger Band; the verdict is invalidated if price falls below S$5.79 support. For non-traders, the indicators suggest waiting for a clearer move beyond nearby support or resistance before treating the current bounce as a trend change.| Measure | Latest reading |
|---|---|
| Last price | S$5.90 |
| SMA20 / SMA50 | S$5.89 / S$5.91 |
| 20-day support / resistance | S$5.79 / S$6.05 |
| RSI / MACD | 49.7 / -0.021 |
| Source and timestamp | Exchange data via Yahoo Finance, October 9, 2026, 16:04 WIB |
Summary Data Sembcorp
| Last price | 5.90 SGD |
| Change 1 day / 5 days / 1 month | 1.37% / 1.03% / -3.28% |
| Trend / MA-cross | sideways / death |
| SMA20 / SMA50 | 5.89 / 5.91 |
| RSI (14) / Stochastic %K | 49.7 / 66.7 |
| Bollinger %B / ATR | 53% / 0.10 |
| Support / Resistance 20 days | 5.79 / 6.05 |
| Data as of | 9 October 2026 16:04 WIB |
Disclaimer: This technical analysis is generated automatically from exchange data (via Yahoo Finance) and indicators calculated by JournalArta, for information and education only. The verdict and the entry, target and stop-loss levels are not investment advice or a solicitation to buy or sell any security. Investment decisions and their risks rest solely with the reader.
Track Sembcorp share price daily: live levels, support/resistance and our full Sembcorp analysis history.