ORCL Stock Analysis: Gains 2.84%, Golden Cross Formed
On Agustus 27, 2026: price 148.87 USD, trend uptrend, RSI 54.8, support 127.56, resistance 156.22. technical analysis of orcl stock. ORCL Stock Analysis — full…
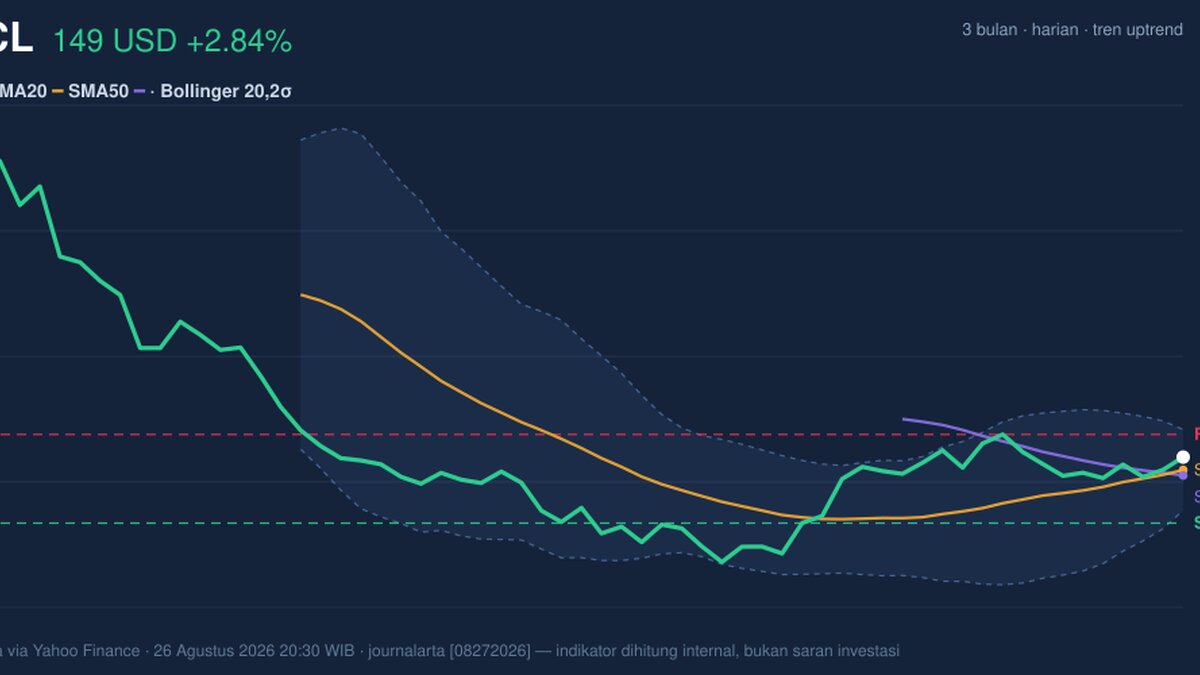
Oracle is trading with a clear upward bias, but the latest move still needs volume confirmation to look durable. As of 26 August 2026 at 20:30 WIB, the shares were at 148.87 USD, up 2.84% on the day and 26.44% over one month, according to Yahoo Finance data through the exchange feed. That puts the stock well above its short-term averages and closer to the upper half of its recent trading band, a sign that buyers remain in control even if the pace of the move has started to cool.
Trend & Price Action
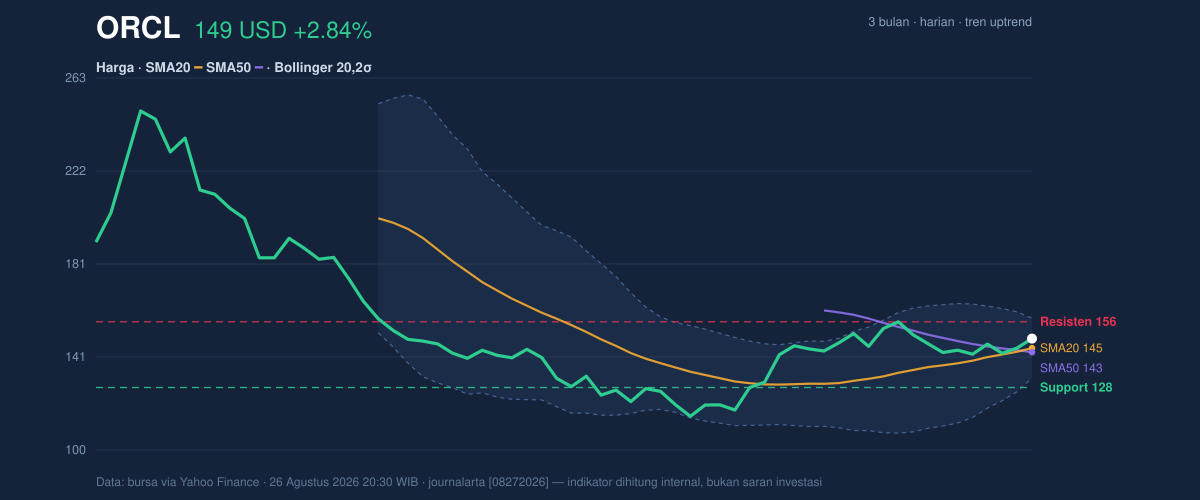
The broad structure is constructive. Oracle is in an uptrend, with the SMA20 at 144.72 above the SMA50 at 142.93, and the two averages have formed a golden cross, where the faster average moves above the slower one. In plain terms, that crossover usually signals that recent price strength has overtaken the longer trend, often a sign that institutional and momentum-driven buyers are leaning in. The stock is also trading above the SMA20, which matters because that average now acts as a near-term reference point: staying above it suggests the pullback risk is being absorbed rather than expanding.
The chart also shows Oracle sitting at 74% of its 20-hour range, with support at 127.56 and resistance at 156.22. That positioning tells a simple story: price is not at the ceiling yet, but it is close enough to resistance that traders will be watching whether the rally can extend through the next pocket of supply. The 3-month high of 250.25 and 3-month low of 114.50 frame the larger context. Oracle has recovered sharply from the lower end of that range, but it is still far below the peak, which means the move is strong without being fully stretched back to prior extremes.
A short pause here matters. The stock has risen fast, but it has not broken its structure.
Oscillators & Momentum
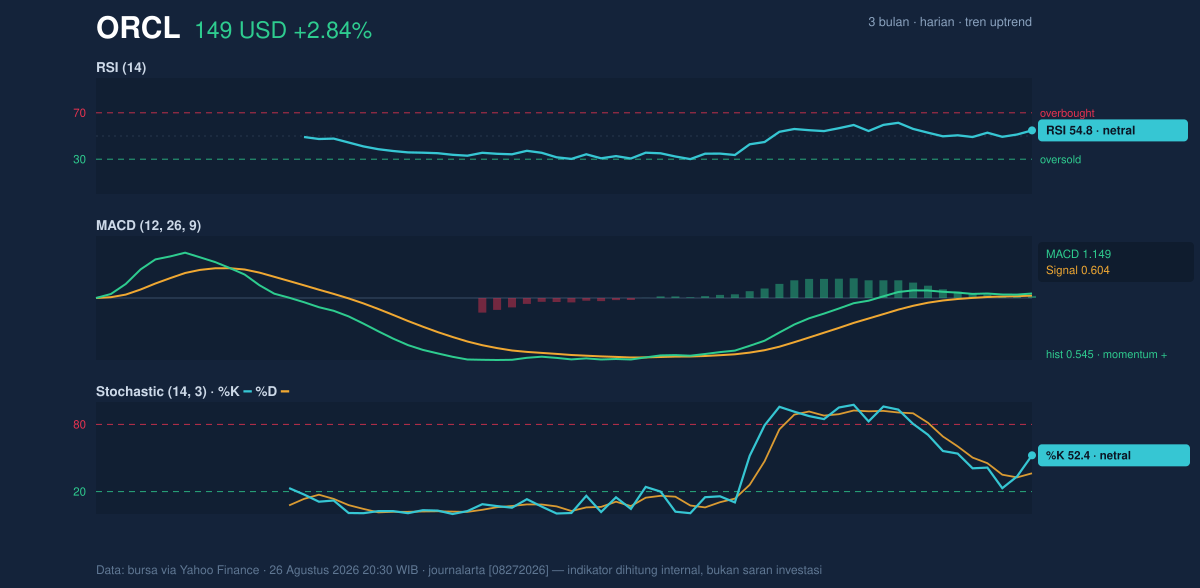
Momentum is positive, though not overheated. The RSI at 54.8 is neutral, which means the stock is not flashing a classic overbought warning even after the recent climb. RSI measures the speed of gains versus losses; a reading in the middle usually suggests the trend has room to continue if buyers keep showing up. The Stochastic %K at 52.4 and %D at 36.3 are also neutral, but the gap between the two lines hints that short-term momentum has improved without becoming extreme. In practical terms, the oscillator set is saying the move is still alive, but it is not yet in the kind of stretched condition that often precedes a snapback.
The strongest confirmation comes from the MACD at 1.149, above its signal line at 0.604, with a positive histogram of 0.545. MACD is a trend-following gauge, and when the main line sits above the signal line, it usually means upward momentum is still outrunning the recent average. The positive histogram shows that gap remains in Oracle’s favor. That is important because it suggests the rally is not just a one-day price spike; the trend still has internal force behind it.
So the oscillators are not shouting “overbought.” They are saying “still constructive.”
Volatility & Volume
Volatility is elevated. The ATR(14) at 6.24, equal to 4.2% of price, means Oracle can move sharply in either direction on a normal trading day. ATR, or average true range, is a measure of how wide daily movement tends to be; a higher reading implies wider swings and less patience for tight stops. That matters because this stock has traveled a meaningful distance in a short time, and any break of support could be fast rather than gradual.
Bollinger Bands reinforce that message. The upper band is 157.77, the middle band is 144.72, and the lower band is 131.66. Price is now above the middle line and sitting at %B 66%, which means it is in the upper part of the band structure but not pressing the top edge. The band width at 18.0% is described as normal, so this is not a squeeze that typically precedes an explosive breakout; instead, it suggests the stock is trading within a healthy but still active volatility envelope.
Volume is the one softer spot. The latest volume was 18,290,000, below the 20-hour average of 26,493,560, or about 0.7x normal. That means the advance has not yet been backed by fully convincing participation on the latest session. However, OBV is rising, which is helpful: On-Balance Volume tracks whether volume is accumulating on up days or fading on down days. A rising OBV tells us that, over time, money flow has still been leaning into the stock even if the latest print was lighter than average.
Key Levels & Scenarios
The immediate map is straightforward. Support at 127.56 is the key line below current price, while resistance at 156.22 and the upper Bollinger band at 157.77 form the next ceiling. If Oracle pushes through the resistance zone, the chart would signal that buyers have absorbed the recent supply and may be attempting a fresh extension. If it fails there, the stock could drift back toward the SMA20 at 144.72, which now serves as the first technical cushion.
The fact that price is already above the middle Bollinger band and above both moving averages is constructive. But because volume was below average, the move still needs follow-through. That is the difference between a trend that is merely rising and one that is being actively confirmed.
Technical Verdict: HOLD (wait & see)
HOLD (wait & see) — the chart is bullish, but the latest move lacks full volume confirmation and is approaching a resistance band that may slow it down.
- Reason 1: Golden cross plus price above the SMA20 and SMA50 keeps the trend structure positive.
- Reason 2: MACD is positive and the histogram remains above zero, showing momentum still favors the upside.
- Reason 3: RSI and Stochastic are neutral, which leaves room for continuation, but volume at 0.7x normal means the latest push is not strongly confirmed.
- Verdict invalidated if price falls below 127.56, because that would break the nearest support and weaken the current uptrend structure.
- Ideal Entry Range: 144.72 to 148.87, centered around the SMA20 at 144.72 and current price zone
- Exit Target: 156.22 to 157.77, using resistance and the upper Bollinger band
- Stop Loss Protection: below 131.66, aligned with the lower Bollinger band; more conservative protection sits below 127.56
For non-traders, this means Oracle is still climbing, but the market wants proof that the rise has enough strength to keep going. “The trend is healthy — it just hasn’t fully earned the next leg yet.”
Summary Data ORCL
| Last price | 148.87 USD |
| Change 1 day / 5 days / 1 month | 2.84% / 3.52% / 26.44% |
| Trend / MA-cross | uptrend / golden |
| SMA20 / SMA50 | 144.72 / 142.93 |
| RSI (14) / Stochastic %K | 54.8 / 52.4 |
| Bollinger %B / ATR | 66% / 6.24 |
| Support / Resistance 20 days | 127.56 / 156.22 |
| Data as of | 26 Agustus 2026 20:30 WIB |
Track ORCL stock price daily: live levels, support/resistance and our full ORCL analysis history.