AIA Stock Analysis: Gains 0.40%, Momentum Gains
On Agustus 28, 2026: price 74.65 HKD, trend sideways, RSI 47.9, support 70.40, resistance 79.65. technical analysis of aia stock. AIA Stock Analysis — full…
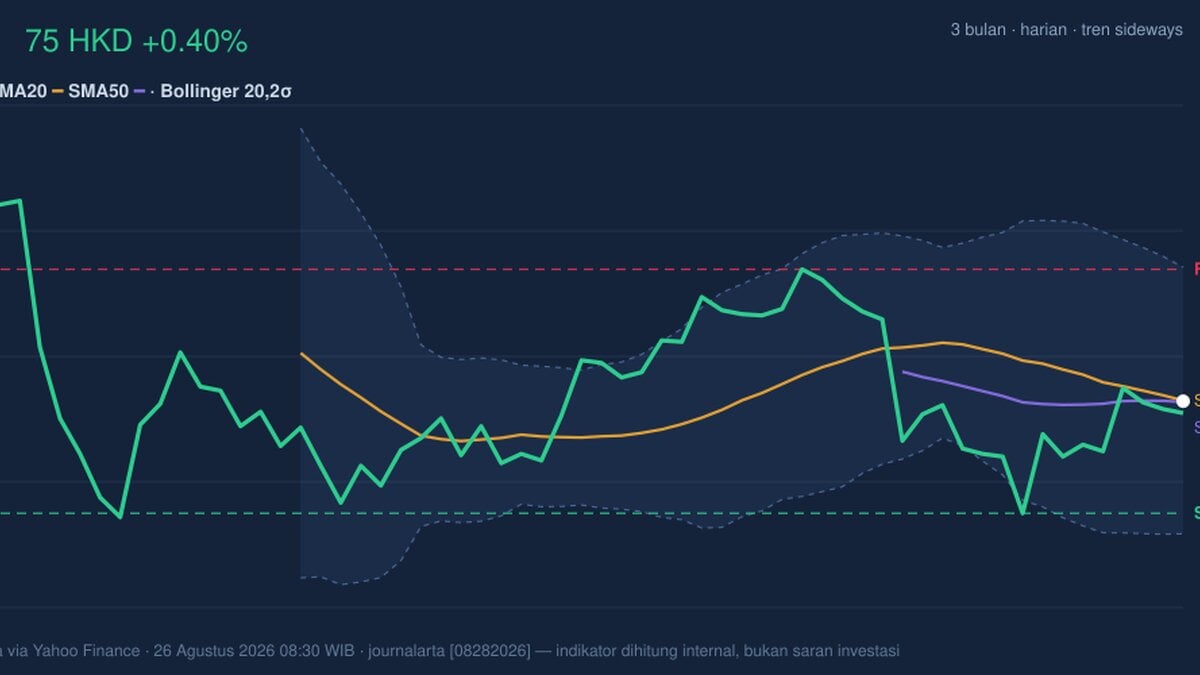
AIA Group’s shares closed at 74.65 HKD, up 0.40% on the day, but the more revealing signal is that the stock is still sitting just below the 20-day moving average at 74.68. That slight gap matters. It suggests the recent bounce has not yet turned into a clean trend break, even though the price is holding near the middle of its short-term range and the MACD has turned positive. In other words, the stock is stabilising, but the chart is still asking for confirmation.
Trend & Price Action
As shown in the chart, AIA is in a sideways trend, with the SMA20 slipping 1.30% over the past five days. A falling short-term average usually means the latest trading has been softer than the prior stretch, even if the stock is not in a full decline. The absence of a fresh MA-cross also matters. When the short and medium averages are close, as they are here with SMA20 at 74.68 and SMA50 at 74.62, the market is often coiling rather than committing.
That coiling is visible in the price location too. The shares are trading around 46% of the 20-hour range, which places them near the middle rather than at an extreme. The broader backdrop is still defined by the 3-month high of 85.10 and the 3-month low of 69.05. That wide band tells readers the stock has already absorbed a meaningful move this year, but the current setup shows no decisive push back toward the upper end yet.
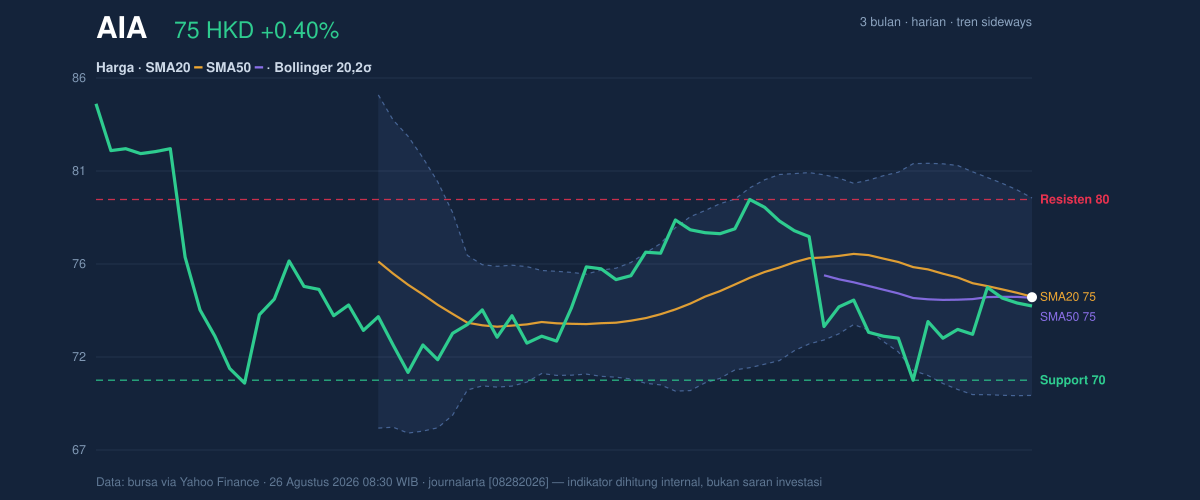
The Bollinger structure reinforces that message. The band midpoint is 74.68, almost identical to the 20-day average, while the upper and lower bands sit at 79.73 and 69.62. With price near the middle and %B at 50%, the chart is neither stretched nor distressed. The 13.5% band width is normal, which means volatility has not compressed into a classic squeeze and has not expanded into a breakout phase either.
Oscillators & Momentum
The momentum picture is more constructive than the trend picture. The RSI at 47.9 is neutral. That is important because it says the stock is not overbought and not oversold; there is room either way, but no strong momentum edge yet. The Stochastic %K at 72.1 and %D at 67.6 sit in a firmer zone, suggesting the recent rebound has some short-term traction. However, because both remain in neutral territory rather than at an extreme, they point to recovery rather than a breakout signal.
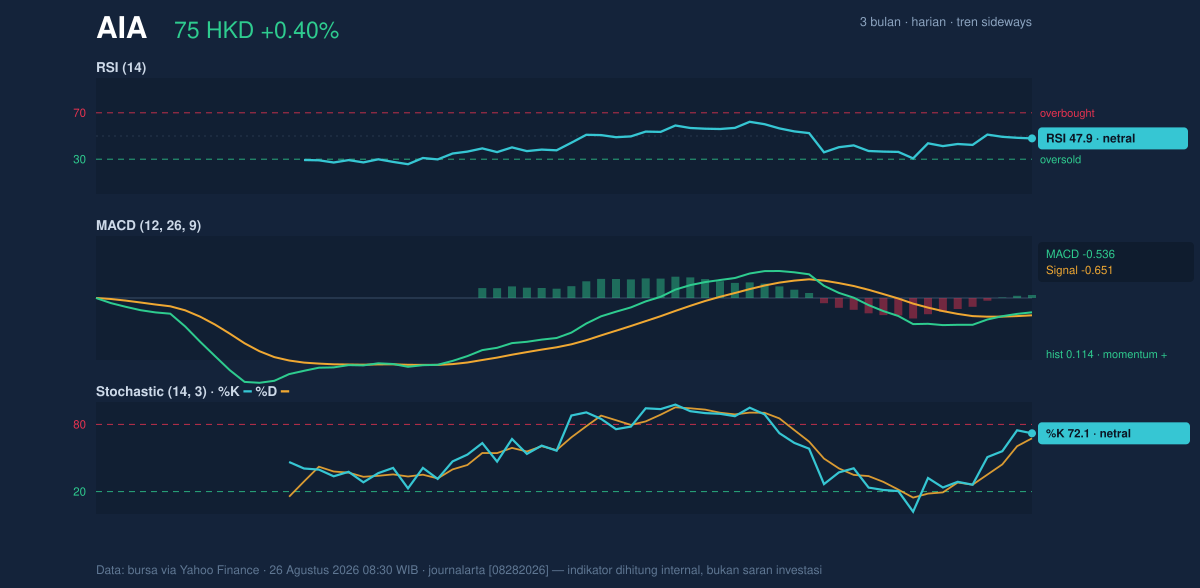
The clearest positive signal comes from the MACD at -0.536, which is still below zero, but above the signal line at -0.651. That crossover produces a positive histogram of 0.114, meaning downside momentum has eased and the stock has started to regain internal strength. For non-specialists, MACD is a trend-following gauge: when it rises above its signal line, it often means selling pressure is fading before price fully responds. Here, that improvement is real, but it is not yet strong enough to override the broader sideways structure.
Volatility & Volume
The ATR of 1.96, equal to 2.6% of price, indicates moderate volatility. That is a useful read because it suggests the stock can move, but not violently on an average session. In practical terms, the current chart setup leaves room for a measured move toward either boundary of the range if catalysts or flows improve.
Volume, however, is not yet confirming the rebound. Last trading volume was 26,859,569, below the 20-day average of 33,147,598, or about 0.8x normal. Lower-than-average participation can mean the move lacks broad conviction. The OBV is falling, and that is a warning sign because on-balance volume tracks whether money is accumulating or leaving the stock. When price edges higher but OBV trends down, the rally may be running ahead of sponsorship.
Key Levels & Scenarios
The chart’s most important reference points are clear. Support at 70.40 is the first line of defence, and the lower Bollinger band at 69.62 sits nearby as an additional technical floor. On the upside, resistance at 79.65 is the nearest barrier, just under the upper Bollinger band at 79.73. That tight alignment makes the level especially important: a move through it would not just clear a round of supply, it would also push price toward the top of the current volatility envelope.
If price holds above the low-70s and volume improves, the stock could continue to rebuild toward the upper range. If it slips back through 70.40, the chart would likely shift from consolidation into renewed pressure, with the 69.62 band and the 3-month low of 69.05 coming back into view. Because the stock is currently near the middle of its range, the next decisive move is more likely to come from a break of one boundary than from gradual drift.
Technical Verdict: HOLD (wait & see)
HOLD (wait & see)
- RSI at 47.9 is neutral, so momentum is not strong enough to call a clean trend reversal.
- MACD is positive versus its signal line, which improves the tone, but it remains below zero and therefore not fully bullish.
- Price is still below SMA20 at 74.68, while volume is only 0.8x normal and OBV is down, so participation is not confirming the bounce.
Verdict invalidated if price breaks below 70.40.
- Ideal Entry Range: 74.62 to 74.68, near the SMA50/SMA20 cluster, or on a confirmed hold above 70.40
- Exit Target: 79.65 to 79.73
- Stop Loss protection: 69.62
For non-traders, this means the stock is improving, but it has not yet shown enough strength to prove the move is lasting.
Summary Data AIA
| Last price | 74.65 HKD |
| Change 1 day / 5 days / 1 month | 0.40% / 2.26% / -4.48% |
| Trend / MA-cross | sideways / none |
| SMA20 / SMA50 | 74.68 / 74.62 |
| RSI (14) / Stochastic %K | 47.9 / 72.1 |
| Bollinger %B / ATR | 50% / 1.96 |
| Support / Resistance 20 days | 70.40 / 79.65 |
| Data as of | 26 Agustus 2026 08:30 WIB |
Track AIA share price daily: live levels, support/resistance and our full AIA analysis history.