Alibaba Stock Technicals Today: Gains 1.14%, Momentum Weakens
On Agustus 28, 2026: price 115.50 HKD, trend sideways, RSI 47.0, support 111.80, resistance 128.10. technical analysis of alibaba stock.
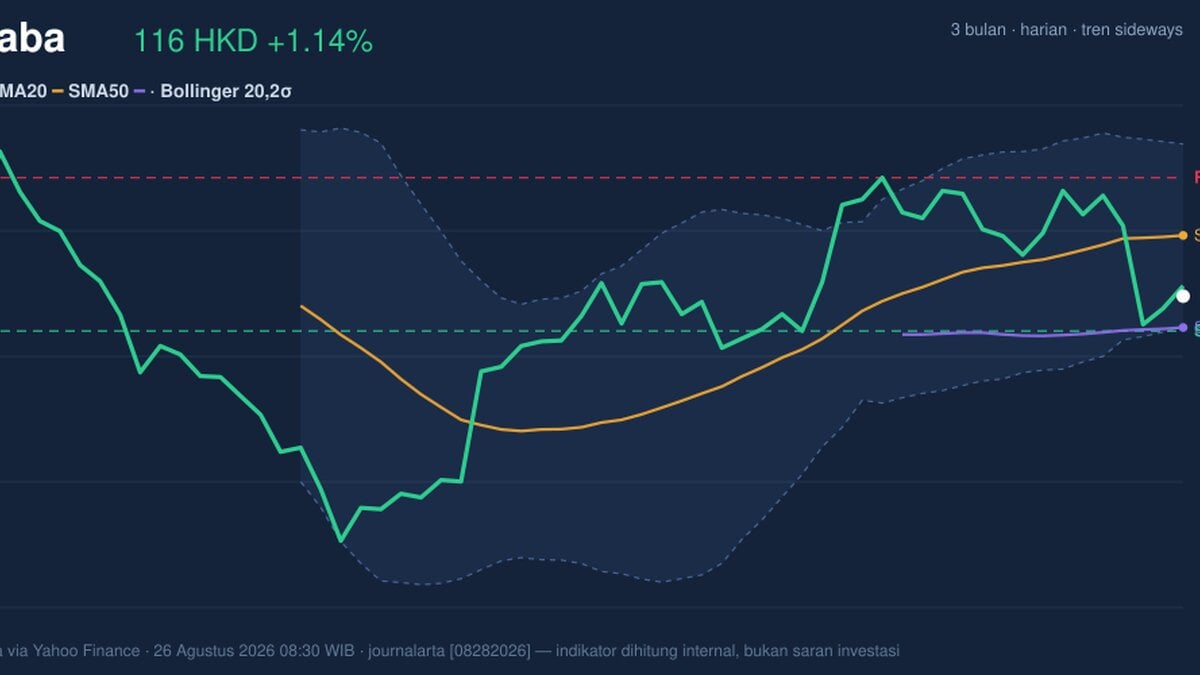
Alibaba Group shares on HKEX slipped to HKD 115.50 on Tuesday, trading below the SMA20 at HKD 121.96 even as the stock stayed above the SMA50 at HKD 112.18, a setup that points to a market still trapped between short-term weakness and a longer base, according to Yahoo Finance data as of 26 August 2026 08:30 WIB. The move came with a 1.14% daily gain, but the bigger signal is that the shares remain in a sideways pattern: not strong enough to reclaim the recent average, yet not weak enough to break the broader floor.
That matters because sideways action often hides a contest between traders reacting to the latest bounce and longer-term holders waiting for proof of direction. Here, the stock is sitting closer to the lower half of its recent range, and that usually means the market is still testing whether support is real or just temporary.
Trend & Price Action
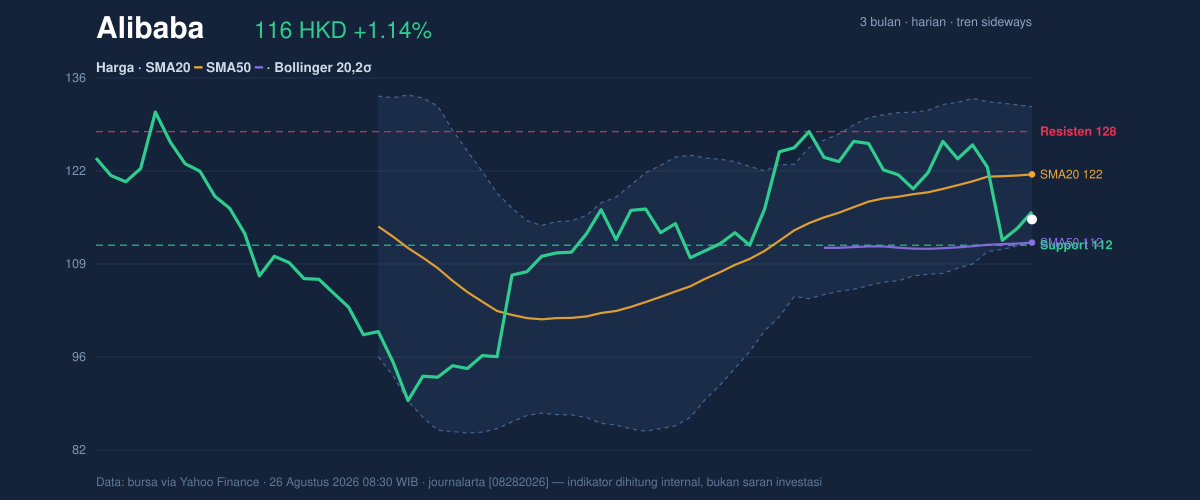
The chart shows Alibaba trading below the SMA20 but above the SMA50, which is a classic sign of mixed trend structure rather than a clean uptrend or downtrend. The lack of a new MA-cross means the moving averages have not delivered a fresh directional signal, so the market is still digesting prior moves instead of committing to one. With the 3-month high at HKD 131.20 and the 3-month low at HKD 88.65, the current price sits closer to the middle-upper part of that band, but the immediate technical posture is softer because the stock remains under the 20-day average.
The 20-hour support at HKD 111.80 is the first line of defense, and the 20-hour resistance at HKD 128.10 is the first ceiling that would need to be reclaimed to shift the tone. Price at roughly 23% of the recent range suggests the market is not pressing the upper boundary; it is still trying to stabilize near the lower end of the active corridor.
A stock in this position is not trending with conviction. It is negotiating.
Oscillators & Momentum
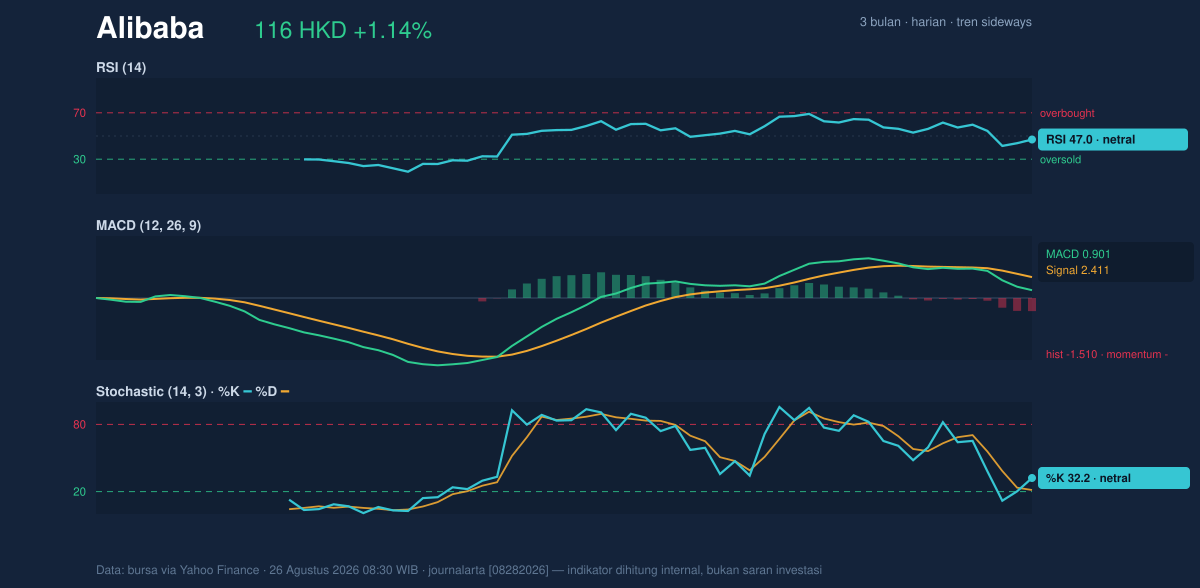
The momentum tools are also telling a story of hesitation. The RSI at 47.0 is neutral, which means Alibaba is neither overbought nor oversold and has room to move in either direction. The Stochastic %K at 32.2 and %D at 21.5 remain neutral as well, but they sit in a zone that often reflects a stock trying to recover from a weak patch rather than one already in a strong upswing. In plain language, buyers are present, but they have not yet seized control.
The more cautionary signal comes from the MACD. The MACD at 0.901 is below the signal line at 2.411, and the histogram at -1.510 shows negative momentum. That negative spread matters more than the headline MACD level: it means recent price action is losing internal strength even though the stock has not broken down decisively. In other words, the bounce exists, but its engine is still running below the signal line.
That is not a collapse signal. It is a warning that the rebound needs confirmation.
Volatility & Volume
Volatility is elevated. The ATR(14) at 5.04, equal to 4.4% of price, tells readers that Alibaba can still swing meaningfully in a single session. When ATR is this high, short-term moves are less about drift and more about sharp testing of nearby support and resistance.
Bollinger Bands reinforce that idea. The stock sits near the lower band, with %B at 17%, which means price is trading close to the bottom of the band structure rather than near the middle or top. The band width at 15.9% is normal, so this is not a squeeze that typically precedes a sudden expansion after a period of compression. Instead, the signal is that price is leaning low within a standard volatility envelope. That often reflects pressure, not panic.
Volume adds a subtle confirmation. The latest 133,860,910 shares traded versus a 20-hour average of 108,163,315, or about 1.2× normal. That means the move is not happening on empty participation. But OBV is down, and that is the more important clue: on-balance volume tracks whether trading flow is accumulating or distributing over time, and a falling OBV suggests the recent activity has not yet translated into durable buying pressure.
A busy tape is not the same as a healthy one.
Key Levels & Scenarios
The immediate technical map is straightforward. HKD 111.80 is the nearest support to watch, and the SMA50 at HKD 112.18 sits almost on top of it, creating a tight decision zone. If that area holds, the stock can continue to trade inside its sideways framework. If it fails, the chart would likely move into a weaker phase because the next cushion is farther away.
On the upside, HKD 121.96 is the first major reclaim level because it is the SMA20 and the middle Bollinger line. A move back above it would show that recent weakness is being absorbed. Beyond that, HKD 128.10 is the near-term resistance that would need to give way before the stock can challenge the upper band near HKD 131.68.
The market is boxed in, but not frozen.
Technical Verdict: HOLD (wait & see)
HOLD (wait & see) because the chart is sending mixed signals: the price is below the SMA20, the MACD histogram is negative, and OBV is falling, yet the stock remains above the SMA50 and near a defined support zone rather than in free fall.
- Reason 1: MACD is below signal and the histogram is negative, showing momentum is still weak.
- Reason 2: Price below SMA20 but above SMA50 suggests an unresolved trend, not a clear breakdown.
- Reason 3: %B at 17% places price near the lower Bollinger band, which can support a rebound but also shows the stock is still under pressure.
- Invalidation: this verdict is invalidated if price falls below HKD 111.80.
- Ideal entry range: HKD 111.80–112.18
- Exit target: HKD 121.96–128.10
- Stop loss protection: below HKD 111.80
For non-traders, the stock is still stuck between a floor and a ceiling, and the next meaningful signal will come from whether it can hold HKD 111.80 or reclaim HKD 121.96.
Summary Data Alibaba
| Last price | 115.50 HKD |
| Change 1 day / 5 days / 1 month | 1.14% / -7.00% / 1.67% |
| Trend / MA-cross | sideways / none |
| SMA20 / SMA50 | 121.96 / 112.18 |
| RSI (14) / Stochastic %K | 47.0 / 32.2 |
| Bollinger %B / ATR | 17% / 5.04 |
| Support / Resistance 20 days | 111.80 / 128.10 |
| Data as of | 26 Agustus 2026 08:30 WIB |
Track Alibaba share price daily: live levels, support/resistance and our full Alibaba analysis history.