AstraZeneca Momentum Gains: Stock Drops 2.90% (Agustus 28, 2026)
On Agustus 28, 2026: price 12,114.00 GBp, trend sideways, RSI 49.4, support 11,460.00, resistance 12,720.00. technical analysis of astrazeneca stock.
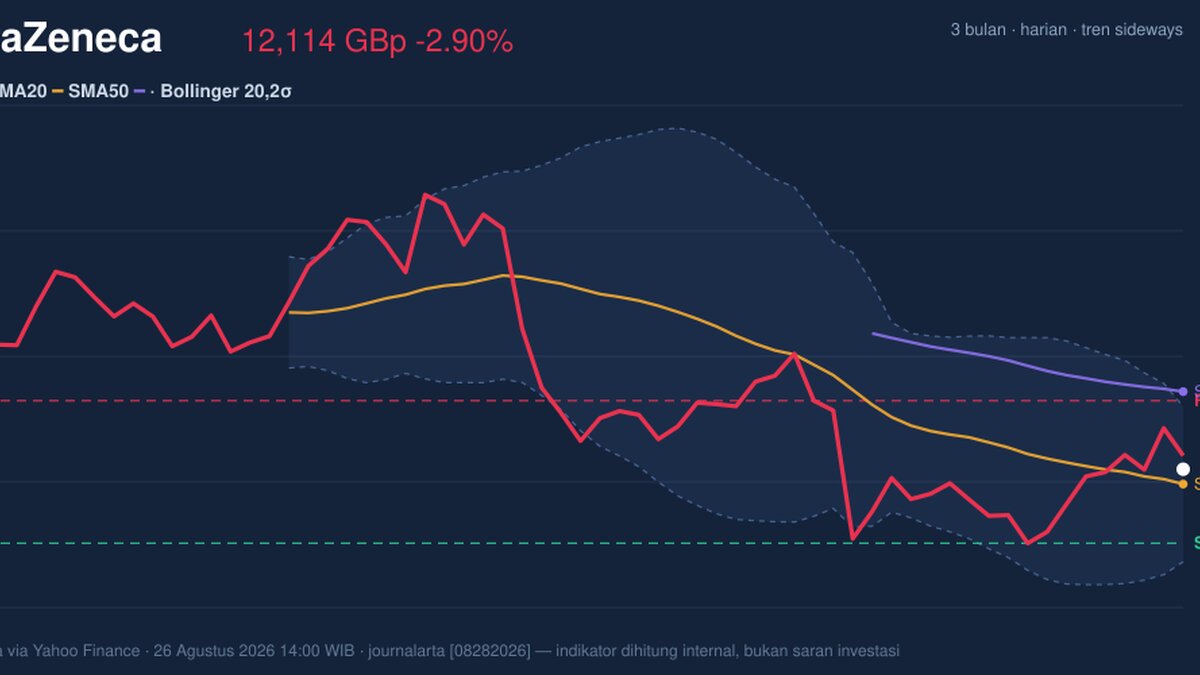
AstraZeneca’s London shares fell to 12,114.00 GBp on Tuesday, down 2.90% from the previous close of 12,476.00, while the stock still sits above its 20-day average but below its 50-day average, a mix that points to a market still deciding whether the recent weakness is a pullback or the start of a deeper reset. As shown in the chart, that positioning matters more than the day’s loss alone: it places the shares in the middle of a broader sideways structure rather than in a clean uptrend or breakdown.
Trend & Price Action
The chart shows AstraZeneca trading in a sideways trend, with the SMA20 at 11,982.10 acting as a short-term reference and the SMA50 at 12,799.88 still sitting overhead. In plain English, that means the stock has recovered enough to stay above its recent average, but not enough to reclaim the longer trend line that often defines whether momentum is improving or fading.
That gap between the two moving averages is important. There is no fresh MA cross, so the market has not yet produced the kind of technical shift that would confirm a new directional phase. The price is 52% through its 20-day range, which is another way of saying it is neither pressing the top of the band nor collapsing toward the bottom. It is sitting in the middle, where conviction is usually weaker and traders wait for a break.
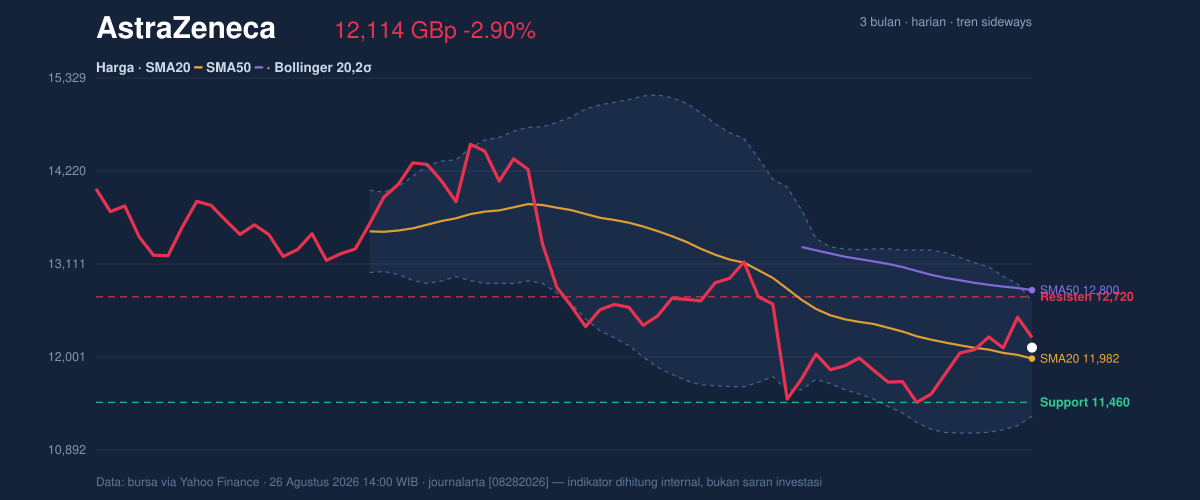
The broader range also gives the current move context. Over three months, AstraZeneca has traded between a 15,126.00 high and a 9,892.00 low. That is a wide corridor, and the present price remains well inside it. The stock is not testing the extremes that usually force a stronger re-rating of the chart.
Oscillators & Momentum
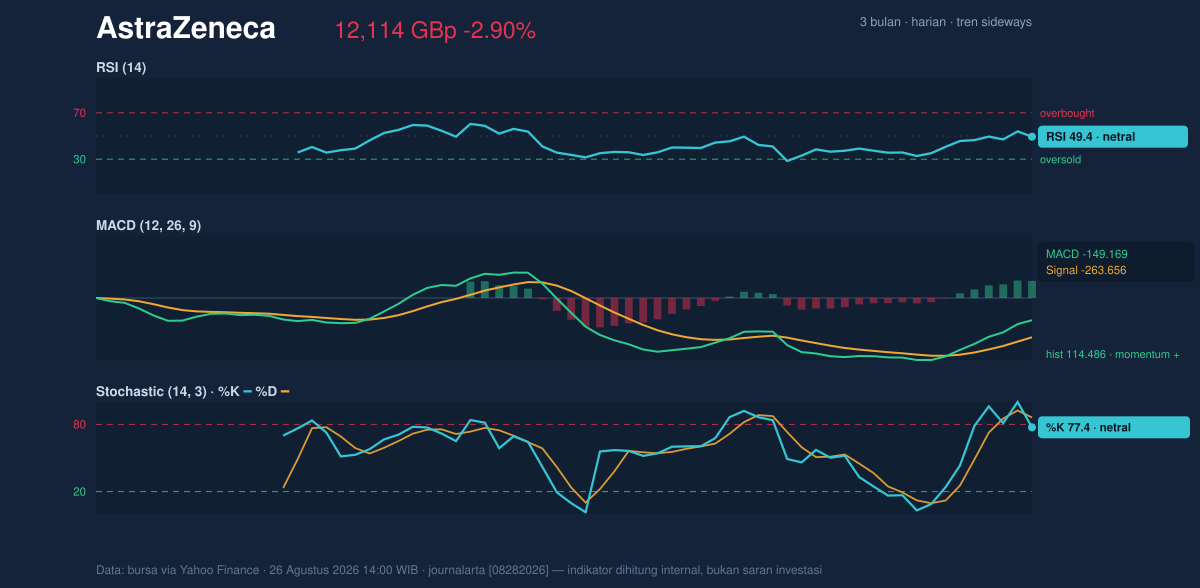
Momentum indicators are mixed, but not alarmingly so. The RSI at 49.4 is effectively neutral, which means the shares are neither overbought nor oversold. That matters because it suggests the recent slide has not yet created a panic condition, but it also means there is no strong momentum tailwind to lean on.
The Stochastic reading of 77.4 / 86.2 is leaning toward the upper end of its range, but it is still classed as neutral in this data set. Read together, the oscillator is hinting that the stock had some short-term lift, yet not enough to establish a decisive breakout. In practical terms, it is a sign of a market that has bounced, then stalled.
The more constructive signal comes from the MACD. With the MACD line at -149.169, the signal line at -263.656, and a positive histogram of 114.486, the indicator says downside momentum has eased and the short-term pace is improving relative to the slower trend. That does not mean the chart is bullish outright. It means the negative trend is losing force, which is often the first step before a more sustained recovery can form.
Volatility & Volume
Volatility is not elevated. The Bollinger Band width of 11.4% is described as normal, and the %B reading of 60% places the share price slightly above the middle of the band. That usually signals a market with room to move in either direction, rather than one stretched to an extreme. The upper band at 12,667.12 is the first technical ceiling to watch, while the lower band at 11,297.08 marks the area where weakness would start to look more serious.
The volume profile is more cautious. Latest turnover of 2,784,068 was only 0.6× normal versus the 20-day average of 4,331,556. That tells you the latest drop was not backed by heavy participation. In market terms, a fall on light volume can mean sellers are not fully committed. The OBV is rising, which reinforces that interpretation: underlying accumulation has been better than the headline price action suggests, even if the pace is not strong enough yet to overpower the broader sideways drift.
Key Levels & Scenarios
The immediate technical map is clear. Support at 11,460.00 is the first level where buyers have previously appeared, and it sits above the lower Bollinger Band at 11,297.08. On the upside, Resistance at 12,720.00 sits just above the upper band at 12,667.12, making that zone a meaningful test for any rebound.
If the shares can push through 12,720.00 with better volume, the chart would begin to argue that the recent weakness was a pause rather than a reversal. If instead the price slips back through 11,460.00, the neutral setup would weaken quickly, because that would bring the lower band and the lower end of the recent range into play. The ATR of 264.08 — about 2.2% of price — suggests moves of that size are normal, so intraday noise should not be confused with a structural break.
Technical Verdict: HOLD (wait & see)
HOLD (wait & see)
- RSI at 49.4 is neutral, so momentum is not strong enough to confirm a new direction.
- MACD histogram at 114.486 is positive, showing improvement, but the stock still trades below SMA50 at 12,799.88.
- Volume at 0.6× normal means the latest move lacks strong participation, even though OBV is rising.
- Verdict invalidated if price falls below 11,460.00, because that would break the nearest support and weaken the neutral base.
- Ideal Entry Range: 11,982.10 to 12,114.00, around the SMA20 and current price zone.
- Exit Target: 12,667.12 to 12,720.00, aligned with the upper Bollinger Band and resistance.
- Stop Loss protection: 11,460.00, at support.
For non-traders, this means AstraZeneca is not showing a clear breakout or breakdown yet, just a stock waiting for the next confirmed move.
Summary Data AstraZeneca
| Last price | 12,114.00 GBp |
| Change 1 day / 5 days / 1 month | -2.90% / 0.53% / -7.77% |
| Trend / MA-cross | sideways / none |
| SMA20 / SMA50 | 11,982.10 / 12,799.88 |
| RSI (14) / Stochastic %K | 49.4 / 77.4 |
| Bollinger %B / ATR | 60% / 264.08 |
| Support / Resistance 20 days | 11,460.00 / 12,720.00 |
| Data as of | 26 Agustus 2026 14:00 WIB |
Track AstraZeneca share price daily: live levels, support/resistance and our full AstraZeneca analysis history.