BAC Testing Support Level: Stock Drops 1.70% (Agustus 28, 2026)
On Agustus 28, 2026: price 61.17 USD, trend sideways, RSI 43.6, support 61.17, resistance 64.81. technical analysis of bac stock. BAC Testing Support Level —…
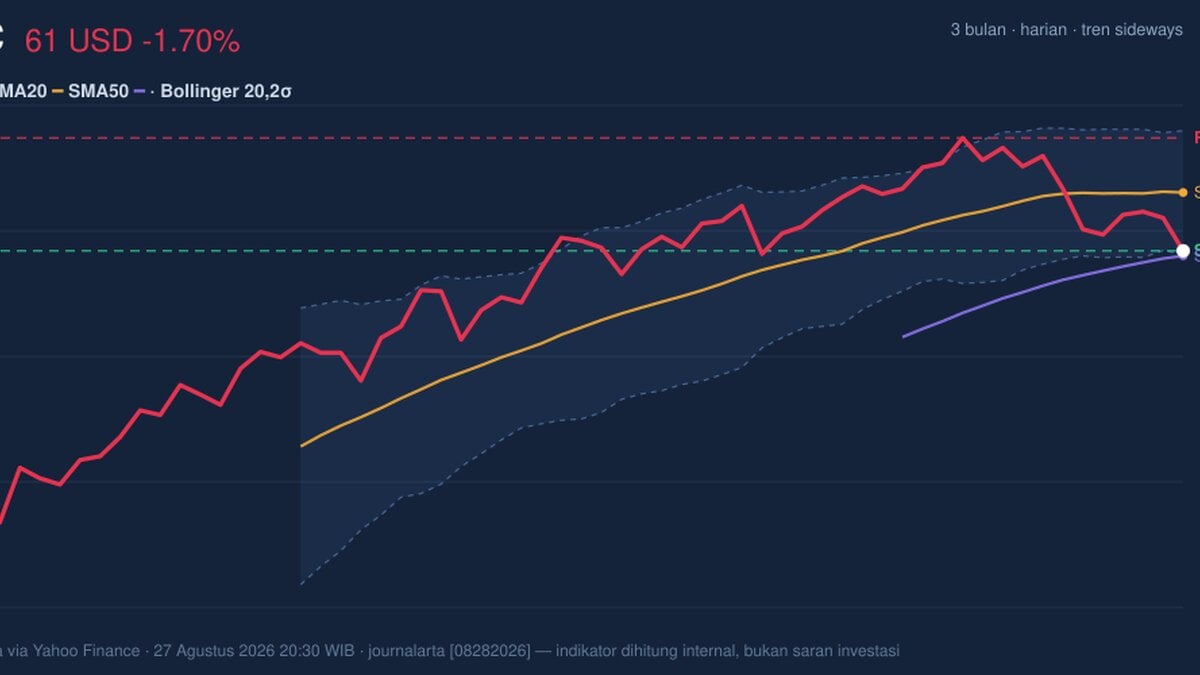
Bank of America is trading at a technical crossroads, with the shares pressing into the lower end of a tightening range even as volume shows unusually heavy participation. The move matters because it suggests investors are not ignoring the stock; they are actively repricing it, and the next break could decide whether the recent weakness is just a pause or something more durable.
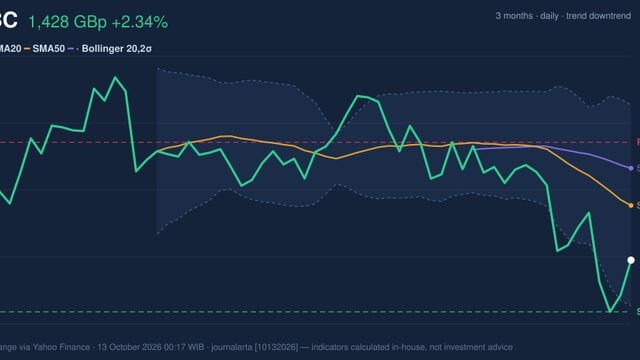
Bank of America Corp. (NYSE: BAC) last changed hands at 61.17 USD, down 1.70% on the day and below its SMA20 at 63.05, while sitting just above the SMA50 at 61.01. That placement is important: the short-term trend has softened, but the longer average is still acting like a floor for now. The chart also shows the stock at the very bottom of its 20-hour range near 61.17, with support at 61.17 and resistance at 64.81. In plain terms, BAC is testing whether recent sellers can push it through a level where buyers have so far been willing to step in.
Trend & Price Action
As shown in the chart, the broader setup is best described as sideways, not trending cleanly in either direction. The SMA20 slope is only 0.02% over five days, which signals a flat market rather than a strong directional push. That matters because a flat moving average often means traders are waiting for a catalyst rather than committing to a sustained trend.
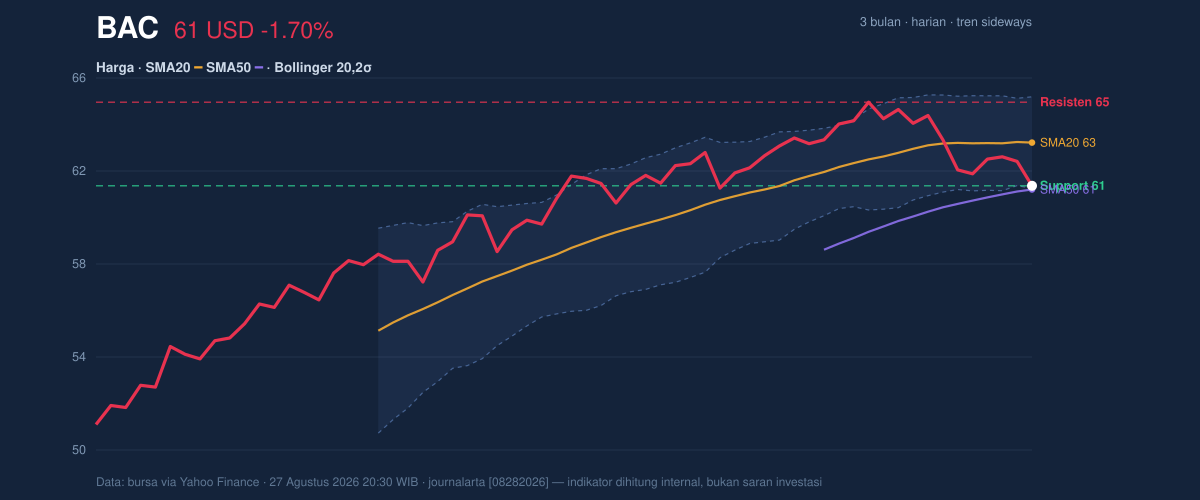
The price sitting below the SMA20 but just above the SMA50 tells a mixed story. Short-term momentum has cooled, yet the stock has not broken the medium-term structure. With no new MA-cross, there is no fresh technical signal that a trend reversal has been confirmed. Instead, BAC looks compressed between nearby averages and range boundaries, a setup that often precedes a sharper move once one side gives way.
The Bollinger Bands reinforce that reading. The bands are narrowing, with 6.3% width, which is a classic squeeze pattern. A squeeze does not predict direction by itself, but it does imply that volatility has been suppressed and a larger move may be building. The stock’s %B at 3% shows price is hugging the lower band, not the middle of the range. That usually means the market is leaning cautious, even if it has not yet broken down decisively.
Oscillators & Momentum
The momentum indicators are less aligned than the price structure. RSI at 43.6 is neutral, which means the stock is neither stretched nor washed out on that measure. But the Stochastic reading of 1.7 / 15.1 is oversold, and that is a sharper signal of near-term exhaustion. Stochastic tends to react faster than RSI, so this combination often suggests the stock has been falling enough to look tired, even if it has not yet turned.
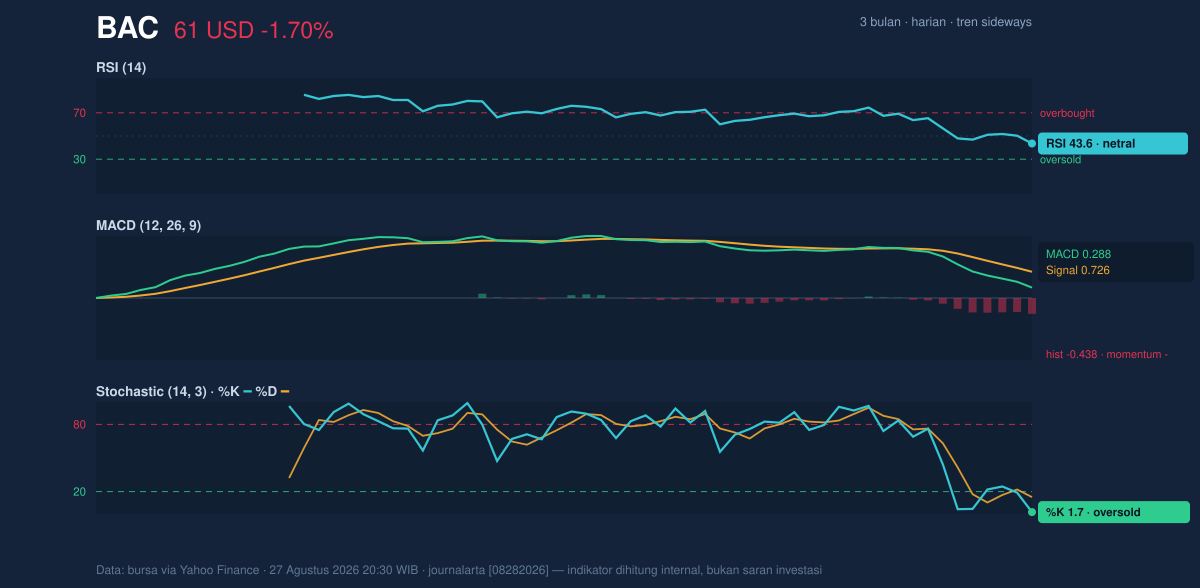
The MACD at 0.288 remains below its signal line at 0.726, leaving a -0.438 histogram. That negative histogram is the clearest momentum warning in the data set: it means downside force still exceeds upside force, even if the stock is not in a full trend collapse. In effect, price is hovering near support, but the momentum engine has not yet flipped back to positive. That mismatch is why the setup feels fragile rather than constructive.
Volatility & Volume
Volume is the most notable confirmation point in the session. Trading reached 49,412,500 shares, or about 1.8x the 20-day average of 27,553,375. Heavy volume during weakness can mean two very different things: either sellers are pressing their case, or buyers are absorbing supply at a key level. The fact that OBV is falling tilts that interpretation toward distribution, meaning the balance of volume flow has been negative rather than supportive.
At the same time, ATR at 1.05, or 1.7% of price, indicates volatility is present but not extreme. That matters because the stock does not need a dramatic macro shock to move; a relatively normal daily swing could be enough to test the nearby band edges. The squeeze in Bollinger Bands and the elevated turnover together suggest the market is coiling, not drifting peacefully.
Key Levels & Scenarios
The immediate map is straightforward. 61.17 is the first level to watch because it is both the latest price and the current support marker. A clean hold there would keep the stock inside the present range, while a failure would expose the lower part of the three-month band, with the 3-month low at 50.61 standing as the wider downside reference. On the upside, 64.81 is the near-term resistance that needs to be reclaimed to shift the tone, and 65.23 is the 3-month high that would mark a stronger breakout from the recent base.
The key signal is not just where BAC sits, but what it is doing around those lines: it is compressed, slightly weak, and still backed by a medium-term moving average that has not yet failed. That combination often produces a false sense of calm before a more decisive move, especially when volume is already elevated.
Technical Verdict: HOLD (wait & see)
HOLD (wait & see)
- Reason 1: Price is below the SMA20 at 63.05, which keeps short-term momentum soft.
- Reason 2: Stochastic is oversold at 1.7 / 15.1, but MACD remains negative, so the rebound case is not yet confirmed.
- Reason 3: Bollinger Bands are squeezing, which points to an approaching move, but not a confirmed direction.
- Verdict invalidated if price falls below 61.01, the SMA50 and nearest structural support.
- Ideal Entry Range: 61.01 to 61.17
- Exit Target: 63.05 to 64.81
- Stop Loss protection: below 61.01, with deeper risk opening toward 50.61 if support fails
In plain English, BAC looks like a stock waiting for a clearer break, not one that has already chosen its direction.
The next technical test is whether the shares can reclaim 63.05 or lose 61.01, with the current squeeze making the next move more important than the last one.
Summary Data BAC
| Last price | 61.17 USD |
| Change 1 day / 5 days / 1 month | -1.70% / -1.12% / -0.91% |
| Trend / MA-cross | sideways / none |
| SMA20 / SMA50 | 63.05 / 61.01 |
| RSI (14) / Stochastic %K | 43.6 / 1.7 |
| Bollinger %B / ATR | 3% / 1.05 |
| Support / Resistance 20 days | 61.17 / 64.81 |
| Data as of | 27 Agustus 2026 20:30 WIB |
Track BAC stock price daily: live levels, support/resistance and our full BAC analysis history.