BP Stock Technicals Today: Drops 2.50%, Testing Support Level
On Agustus 28, 2026: price 515.40 GBp, trend sideways, RSI 47.5, support 514.90, resistance 552.50. technical analysis of bp stock. BP Stock Technicals — full…
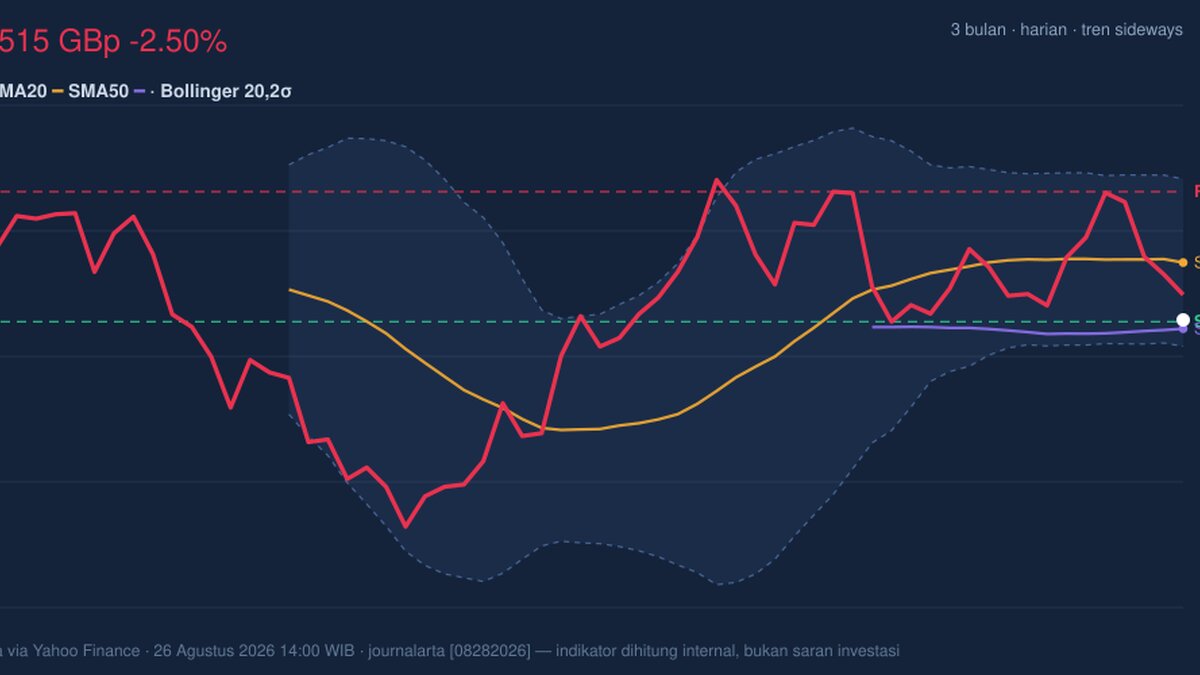
International investors are watching BP plc as the shares test the lower end of a three-month range while short-term momentum weakens. The stock finished at 515.40 GBp on the LSE, down 2.50% on the day and below its recent short-term trend markers, a setup that says the market is still digesting weaker sentiment rather than building a clear rebound.
Trend & Price Action
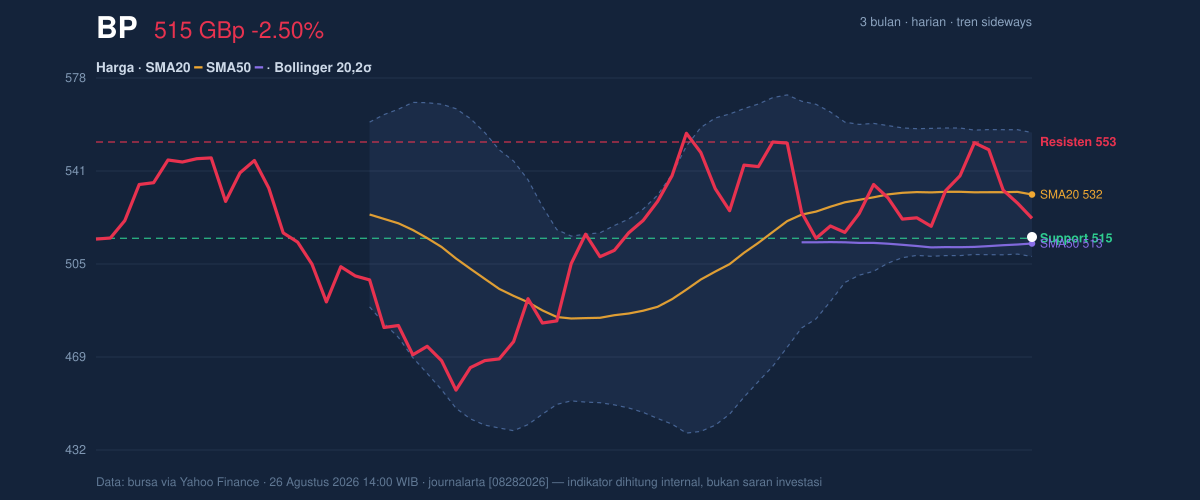
BP’s latest move matters because it sits in a classic “range-bound but fragile” pattern. The shares are still described as sideways, but the slope of the SMA20 at -0.20% over 5 days shows that the short-term trend is tilting lower, even if only modestly. More importantly, the price is trading below the SMA20 at 532.00 and only just above the SMA50 at 512.86, which means the market is hovering near a technical line that often separates consolidation from a deeper pullback.
There is no fresh MA-cross, so the chart does not yet show a decisive trend reversal signal. That matters: when moving averages have not crossed, the market is usually still searching for direction, and the current price position suggests sellers have the upper hand in the near term without a full breakdown. As shown in the chart, BP is also close to the lower band of its recent trading envelope, with the 3-month low at 450.60 still distant enough to leave room for a range trade, but the 3-month high at 562.90 now looks like a tougher ceiling after the recent slide.
Oscillators & Momentum
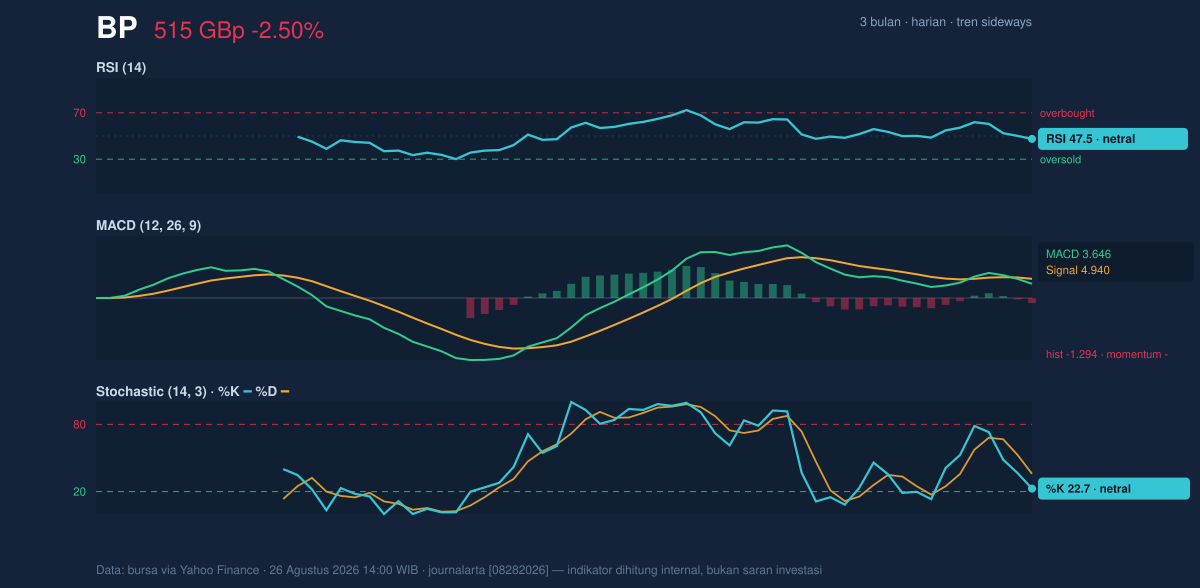
The momentum picture is softer than the headline trend suggests. The RSI at 47.5 is neutral, which tells readers the stock is neither deeply oversold nor overbought; in plain English, the market has not reached an obvious exhaustion point. But neutrality is not the same as strength. The Stochastic %K at 22.7 and %D at 35.9 imply the shares are drifting toward the lower end of the recent range, and because the %K is below %D, the short-term momentum is still lagging.
The clearest warning comes from MACD at 3.646 versus the signal line at 4.940, with a histogram of -1.294. That combination means downside momentum is currently stronger than the underlying trend signal. In practical terms, MACD is saying the price may be losing energy rather than building it. It is not a panic signal, but it does confirm that BP has not yet turned the corner.
Volatility & Volume
Volatility is present, but not extreme. The ATR(14) at 12.52, equal to 2.4% of price, suggests BP can still move enough in a session to matter, but not in a disorderly way. The Bollinger Band width of 9.1% is described as normal, which means the market is not in a squeeze that usually precedes a sharp breakout, nor in a panic expansion that would signal disorder. The more telling number is %B at 16%: price is sitting near the lower part of the Bollinger structure, close to the lower band at 507.80. That often signals pressure is concentrated on the downside, though it can also attract bargain-finding flows if selling eases.
Volume adds an important layer. The latest turnover of 66,290,672 shares is about 1.3× normal, which means the sell-off is not happening on thin trading. In other words, participation is real. Yet OBV is falling, and that matters because on-balance volume tracks whether money is accumulating or leaving the stock. A falling OBV alongside a weaker price usually confirms that rallies are meeting supply rather than fresh demand.
Key Levels & Scenarios
The immediate battlefield is tight. BP is trading near the 20-hour support at 514.90 and well below the 20-hour resistance at 552.50, leaving it positioned near the bottom of that range. The chart also shows the Bollinger lower band at 507.80, which sits just beneath spot and can act as the next technical cushion. If that area gives way, the market would be looking more seriously at the lower half of the broader range, with the 3-month low at 450.60 becoming the next major reference point.
On the upside, any recovery first needs to reclaim the SMA50 at 512.86 decisively and then challenge the SMA20 at 532.00. A move through 552.50 would matter because it would push price back into the upper part of the recent trading band and reduce the current downside bias. Until that happens, the chart still reads as a stock trying to stabilise rather than one already in recovery.
Technical Verdict: HOLD (wait & see)
The setup is neither strong enough for an upside confirmation nor weak enough for a clean breakdown verdict. HOLD (wait & see) fits best because:
- Price is below the SMA20 at 532.00, which keeps the short-term trend pressure negative.
- MACD is below its signal line and the histogram is negative, showing momentum is still fading.
- RSI at 47.5 is neutral, so the market has not reached a clear oversold reset that would support a stronger reversal case.
Verdict invalidated if price falls below 507.80, the Bollinger lower band and nearby technical support.
- Ideal entry range: 507.80 to 514.90
- Exit target: 532.00, then 552.50 if momentum improves
- Stop loss protection: below 507.80
In plain English: BP is sitting in a weak but not broken technical position, and the next move will depend on whether it can defend the low 510s and climb back above its short-term average.
The next market test is whether BP can hold 514.90 and then regain 532.00 in the sessions ahead.
Summary Data BP
| Last price | 515.40 GBp |
| Change 1 day / 5 days / 1 month | -2.50% / -4.43% / -5.17% |
| Trend / MA-cross | sideways / none |
| SMA20 / SMA50 | 532.00 / 512.86 |
| RSI (14) / Stochastic %K | 47.5 / 22.7 |
| Bollinger %B / ATR | 16% / 12.52 |
| Support / Resistance 20 days | 514.90 / 552.50 |
| Data as of | 26 Agustus 2026 14:00 WIB |
Track BP share price daily: live levels, support/resistance and our full BP analysis history.