DIS Momentum Gains: Stock Drops 2.56% (Agustus 28, 2026)
On Agustus 28, 2026: price 106.82 USD, trend uptrend, RSI 56.6, support 96.19, resistance 111.25. technical analysis of dis stock. DIS Momentum Gains — full…
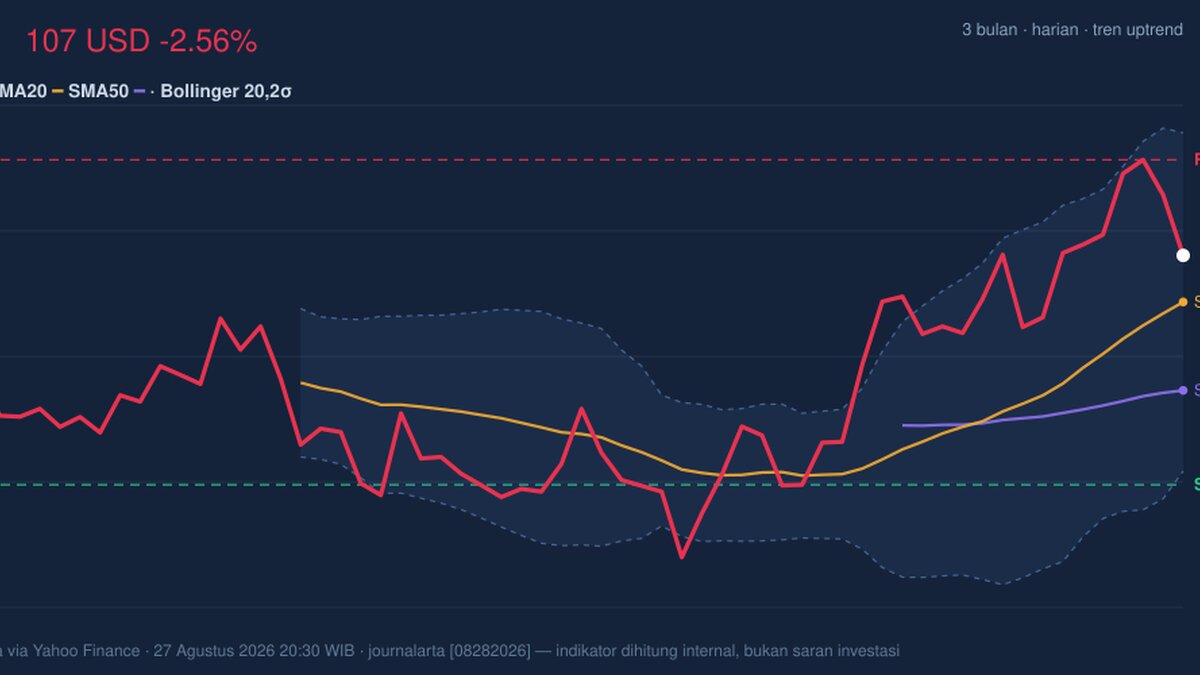
Walt Disney shares closed at 106.82 on the NYSE, down 2.56% from the previous close of 109.63, but the bigger signal is that the stock is still trading above both its short- and medium-term trend lines. As of 27 August 2026, the price remains above the SMA20 at 104.66 and well above the SMA50 at 100.56, which means the recent pullback has not yet broken the broader upward structure. In plain terms, the market is treating this as a pause inside an uptrend, not a trend failure.
Trend & Price Action
The chart shows Disney sitting in the upper half of its recent range, at roughly 71% of the way from the 20-hour support at 96.19 to the 20-hour resistance at 111.25. That positioning matters because it says buyers have already reclaimed a good portion of the range after the stock’s move higher over the past month, even if the last session was softer. The stock is also just below its 3-month high of 111.87, which is important: markets often hesitate near prior peaks because that is where earlier sellers may return.
The trend signal remains constructive. The SMA20 is rising at 3.00% over 5 days, a slope that suggests near-term momentum is still pointing upward. There is no fresh MA cross, so this is not a breakout driven by a new moving-average signal; instead, it is an established trend being tested. That usually means the next move depends less on the headline number and more on whether the price can keep holding above the middle of the Bollinger band.
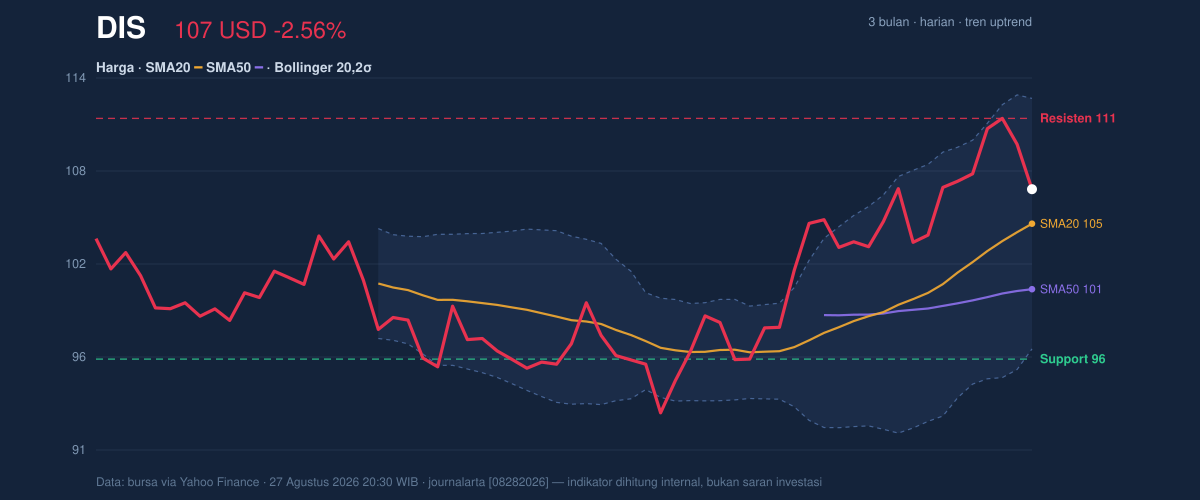
The Bollinger setup reinforces that reading. Price is above the 104.66 mid-band and below the 112.50 upper band, with %B at 64%. That places Disney in the upper part of the band, but not at an extreme. The 15.0% band width is normal, which suggests the stock is not in a compression phase that usually precedes a violent move. Instead, the current structure points to a steady market that is still digesting gains.
Oscillators & Momentum
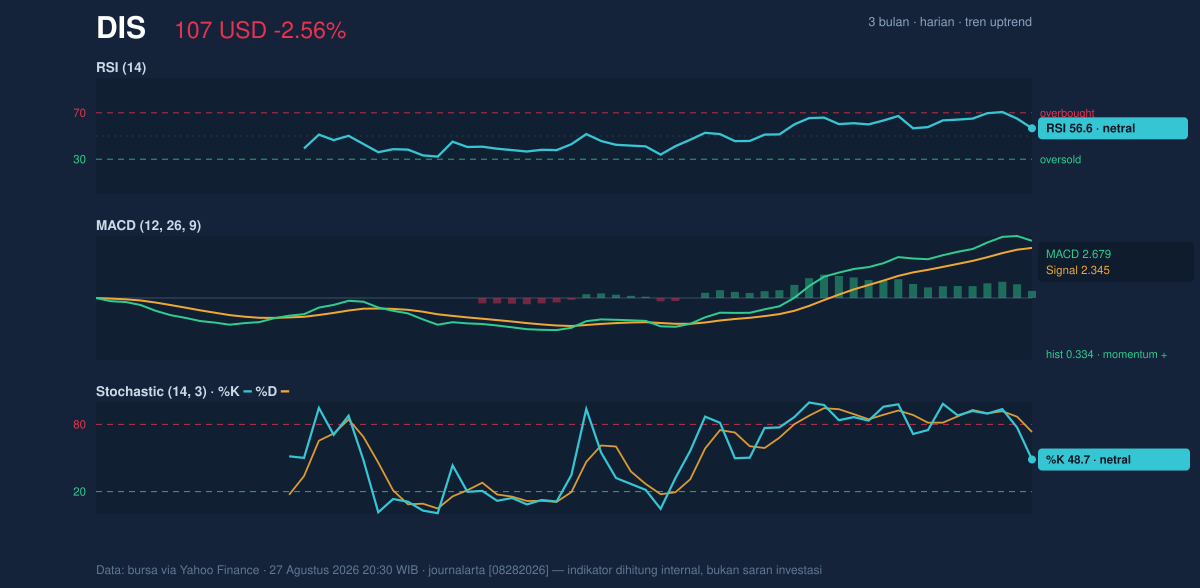
Momentum is positive, but not stretched. The RSI at 56.6 sits in neutral territory, which means the stock is not overbought despite the one-month gain of 11.09%. That is a healthy sign: strong trends often weaken when RSI gets too hot, but here the indicator leaves room for further upside if buyers return. The Stochastic %K at 48.7 and %D at 73.2 are both described as neutral, but their gap is worth watching. When the fast line sits below the slower one, it can reflect fading short-term enthusiasm even while the broader trend remains intact.
The strongest momentum clue comes from MACD. The MACD at 2.679 is above its signal line at 2.345, with a positive histogram of 0.334. In simple terms, that means upward momentum still exceeds downward pressure. The signal is not explosive, but it is supportive: the trend is alive, and the recent dip looks more like a cooling-off period than a reversal. Still, the fact that RSI is neutral and Stochastic is not leading higher tells you the move is no longer accelerating.
Volatility & Volume
Disney’s ATR of 2.28, equal to 2.1% of price, points to moderate daily movement. That is useful because it suggests the stock is not behaving erratically; traders are getting manageable swings rather than wide, disorderly gaps. Combined with the normal Bollinger width of 15.0%, the message is that volatility is present but not elevated enough to imply panic or euphoria.
Volume adds a more nuanced layer. The latest session traded 8,699,500 shares, below the 20-day average of 9,796,840, or about 0.9x normal. That means the decline was not backed by unusually heavy selling pressure. In market terms, a down day on lighter volume often carries less conviction than a down day on surging turnover. The OBV is rising, which is another constructive sign because on-balance volume tracks whether money flow has generally favored accumulation. Price may have slipped, but participation still leans supportive.
Key Levels & Scenarios
The nearest battleground is clear. On the downside, 104.66 is the first important line because it is both the SMA20 and the Bollinger middle band. If Disney loses that level, the stock would be signaling that its short-term trend is losing traction. Below that, the more meaningful floor is 96.82, the lower Bollinger band, with 96.19 as the nearby support marker. That zone matters because it sits close to the lower edge of the current range and would likely attract attention if the pullback deepens.
On the upside, 111.25 is the first resistance to clear, and 111.87 is the more important three-month high. A move through that area would tell the market that Disney has absorbed supply near its recent peak and may be ready to extend the uptrend. For now, the stock is close enough to resistance that the next move still needs confirmation rather than assumption.
The core signal is that Disney remains technically constructive, but it is now testing whether its recent uptrend can hold above the mid-band and short-term support. A decisive break below 104.66 would weaken that case; a push through 111.25 would strengthen it.
Technical Verdict: HOLD (wait & see)
- Reason 1: MACD is positive and the histogram remains above zero, which supports the trend.
- Reason 2: Price is above SMA20 and SMA50, so the broader structure is still upward.
- Reason 3: RSI is neutral and volume is only 0.9x normal, which argues for patience rather than chasing the move after a soft session.
- Verdict invalidated if price breaks below 104.66, because that would mean Disney has lost the short-term trend line and the Bollinger mid-band at the same time.
- Ideal Entry Range: 104.66 to 106.82
- Exit Target: 111.25 to 111.87
- Stop Loss protection: 96.82 to 96.19
For non-traders: Disney still looks technically healthy, but the chart says it is better to wait for confirmation than to assume the next move will automatically extend higher.
“The market is asking Disney to prove that this pullback is only a pause.”
Summary Data DIS
| Last price | 106.82 USD |
| Change 1 day / 5 days / 1 month | -2.56% / -0.47% / 11.09% |
| Trend / MA-cross | uptrend / none |
| SMA20 / SMA50 | 104.66 / 100.56 |
| RSI (14) / Stochastic %K | 56.6 / 48.7 |
| Bollinger %B / ATR | 64% / 2.28 |
| Support / Resistance 20 days | 96.19 / 111.25 |
| Data as of | 27 Agustus 2026 20:30 WIB |
Track DIS stock price daily: live levels, support/resistance and our full DIS analysis history.