HSBC Testing Support Level: Stock Drops 0.86% (Agustus 28, 2026)
On Agustus 28, 2026: price 1,504.00 GBp, trend sideways, RSI 51.2, support 1,497.20, resistance 1,597.40. technical analysis of hsbc stock.
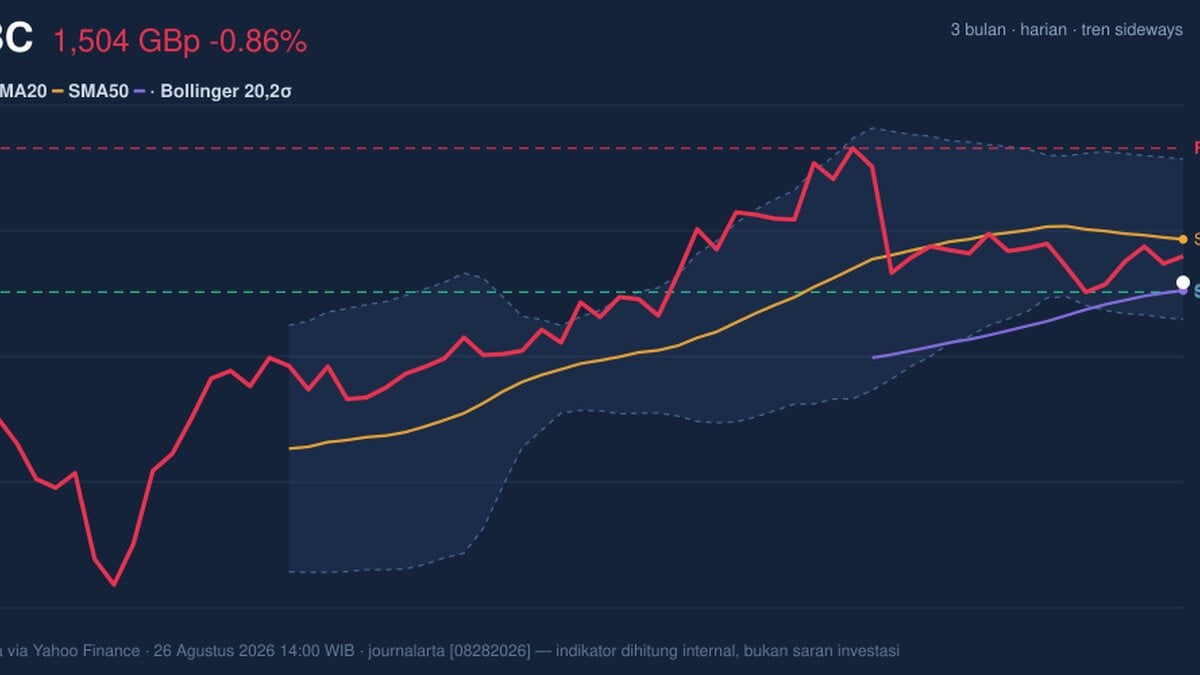
1,504.00 GBp is where HSBC Holdings’ London-listed shares finished the latest session, down 0.86% from the previous close of 1,517.00, and still below the 20-day average of 1,534.00. That combination matters more than the day’s small loss on its own: the stock is sitting under short-term trend resistance, but it is also hovering just above the 50-day average at 1,498.33, which means the market has not yet decided whether this is a pause in a broader sideways pattern or the start of a deeper drift lower.
Trend & Price Action
The chart shows a stock that has been moving sideways, not trending cleanly in either direction, with the 20-day moving average slipping by 0.45% over five days. That gentle downward slope tells you short-term momentum has softened, even if the decline is not severe. The key detail is that HSBC is trading below its SMA20 at 1,534.00 but still above its SMA50 at 1,498.33, leaving price pinned between short-term weakness and medium-term support. No fresh moving-average cross has appeared, so there is no strong trend signal yet. As shown in the chart, the stock is also in the lower portion of its Bollinger range, with price near the lower band rather than the middle line.
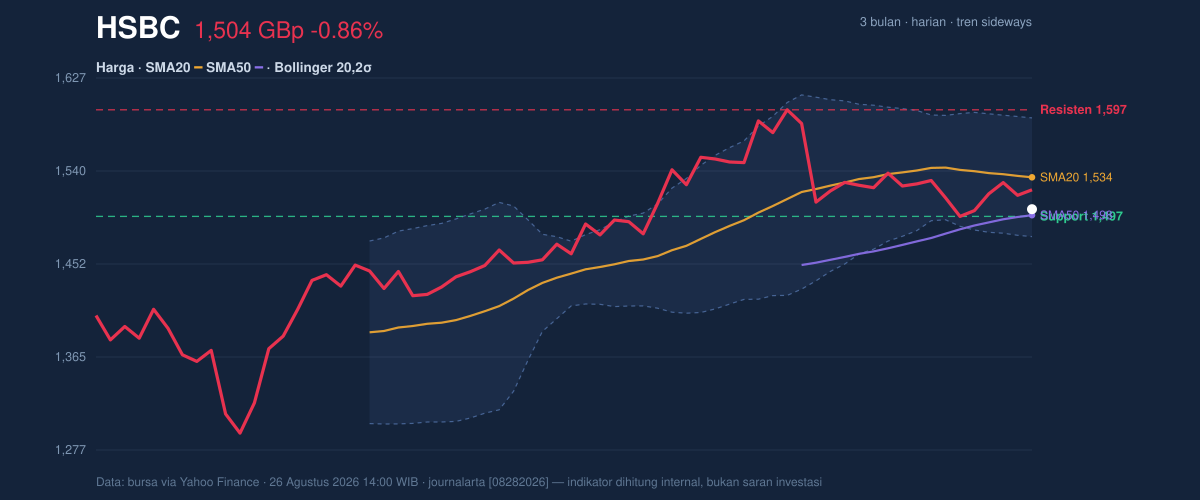
That positioning is important because it implies the market is not pricing in a decisive breakout. It is waiting.
The share price is also only about 7% of the way up from the 20-day support at 1,497.20 toward resistance at 1,597.40, which reinforces the idea that the recent move is still range-bound. The broader 3-month range, from 1,267.20 to 1,610.00, shows the current price is closer to the upper end of that band than the lower end, but not near the highs. In practical terms, the stock is neither cheap on a momentum basis nor extended enough to suggest a strong breakout is already underway.
Oscillators & Momentum
The momentum readings are mixed, and that mix is the real story. RSI at 51.2 is neutral, which means the stock is neither overbought nor oversold. Stochastic %K at 52.3 and %D at 51.4 are also neutral, showing short-term price pressure is balanced rather than stretched. But the MACD picture is less friendly: MACD at 3.320 sits below its signal line at 7.678, leaving a negative histogram of -4.357. That configuration usually means upward momentum is fading before price fully reflects it, or that any rebound has not yet earned confirmation.
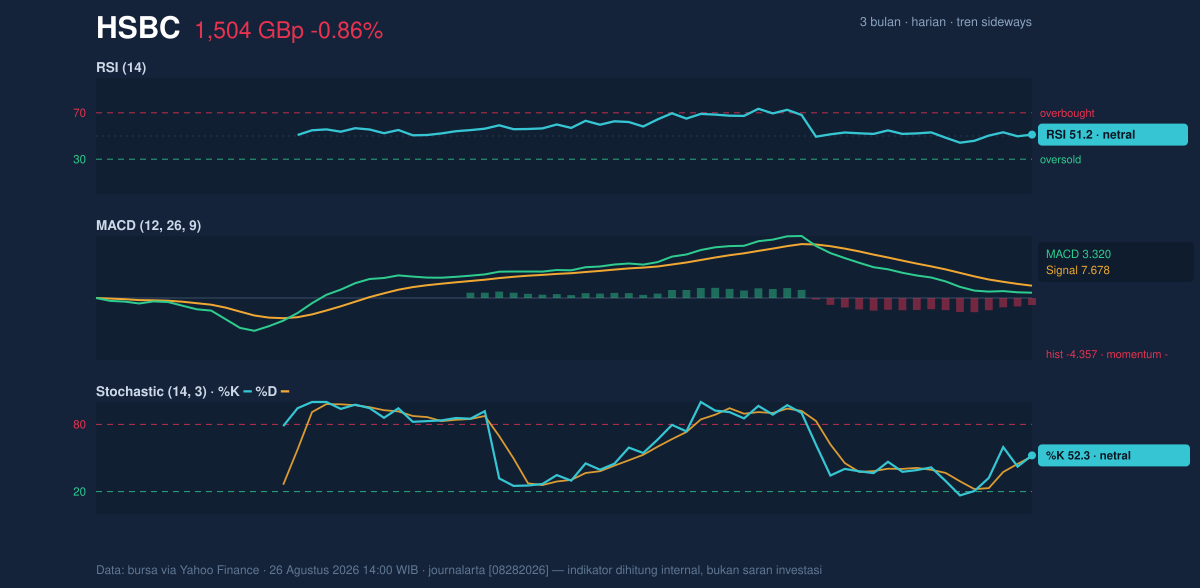
This is the key tension in HSBC right now. The oscillators are not warning of an immediate selloff, but the MACD says the recent bounce has not regained control. In plain language, the stock is not oversold enough to look washed out, and not strong enough to look decisively re-accelerating. The result is a neutral-to-soft technical backdrop.
Volatility & Volume
Volatility is contained, but not dead. The Bollinger Bands are relatively tight, with a width of 7.3%, which often signals a squeeze — a period when price compresses before a larger move. A squeeze does not predict direction; it simply says the next meaningful move can come faster once the market chooses a side. %B at 23% shows price is trading in the lower part of the band structure, which leans toward pressure on the downside unless buyers can reclaim the middle band at 1,534.00.
ATR at 22.96, or 1.5% of price, suggests volatility is moderate rather than extreme. That matters because a moderate ATR gives room for a move without implying panic. Volume, however, is quieter than usual: 14,705,924 shares changed hands versus a 20-day average of 26,309,654, or about 0.6x normal. Thin volume can weaken the reliability of price moves because fewer participants are backing the move. Yet OBV is rising, which is a useful counterpoint: on-balance volume tracks whether money flow is accumulating or distributing over time, and a rising OBV suggests underlying demand has not disappeared even as the latest session was soft.
So the message from participation is not outright bearish. It is cautious.
Key Levels & Scenarios
The nearest levels are clear. Support sits at 1,497.20, almost directly aligned with the SMA50 at 1,498.33, which makes that zone especially important. If price can hold above that area, the market can still treat the current move as a consolidation rather than a breakdown. Above, resistance is 1,597.40, and that sits close to the upper Bollinger band at 1,589.83. That pairing matters because a move into that zone would need both price expansion and stronger participation to look convincing.
If HSBC loses 1,497.20, the chart would shift from neutral sideways action toward a more fragile structure, because the stock would be slipping beneath both the 50-day average and the nearest support. If it reclaims 1,534.00, the tone improves, since that would put price back above the middle Bollinger band and the 20-day average, the two most visible short-term reference points on the chart.
The core signal is a compressed, neutral range with slightly negative momentum and a still-intact medium-term floor.
Technical Verdict: HOLD (wait & see)
HOLD (wait & see)
- MACD is negative versus its signal line, so short-term momentum is not yet confirming strength.
- Price is below SMA20 at 1,534.00 but still above SMA50 at 1,498.33, which leaves the trend undecided.
- Bollinger Bands are squeezed, meaning a larger move may be coming, but direction is not confirmed.
- Verdict invalidated if price falls below 1,497.20, because that would break the nearest support and the 50-day average together.
- Ideal Entry Range: 1,497.20 to 1,534.00
- Exit Target (Target Price): 1,589.83 to 1,597.40
- Stop Loss protection: below 1,497.20
In plain English: HSBC is sitting in a tight technical range, and the next meaningful move depends on whether 1,497.20 holds or gives way.
Summary Data HSBC
| Last price | 1,504.00 GBp |
| Change 1 day / 5 days / 1 month | -0.86% / 0.45% / -2.83% |
| Trend / MA-cross | sideways / none |
| SMA20 / SMA50 | 1,534.00 / 1,498.33 |
| RSI (14) / Stochastic %K | 51.2 / 52.3 |
| Bollinger %B / ATR | 23% / 22.96 |
| Support / Resistance 20 days | 1,497.20 / 1,597.40 |
| Data as of | 26 Agustus 2026 14:00 WIB |
Track HSBC share price daily: live levels, support/resistance and our full HSBC analysis history.