Momentum Weakens, INTC Stock Gains 4.36% Today
On Agustus 28, 2026: price 92.09 USD, trend sideways, RSI 44.0, support 87.26, resistance 104.56. technical analysis of intc stock. Momentum Weakens — full…
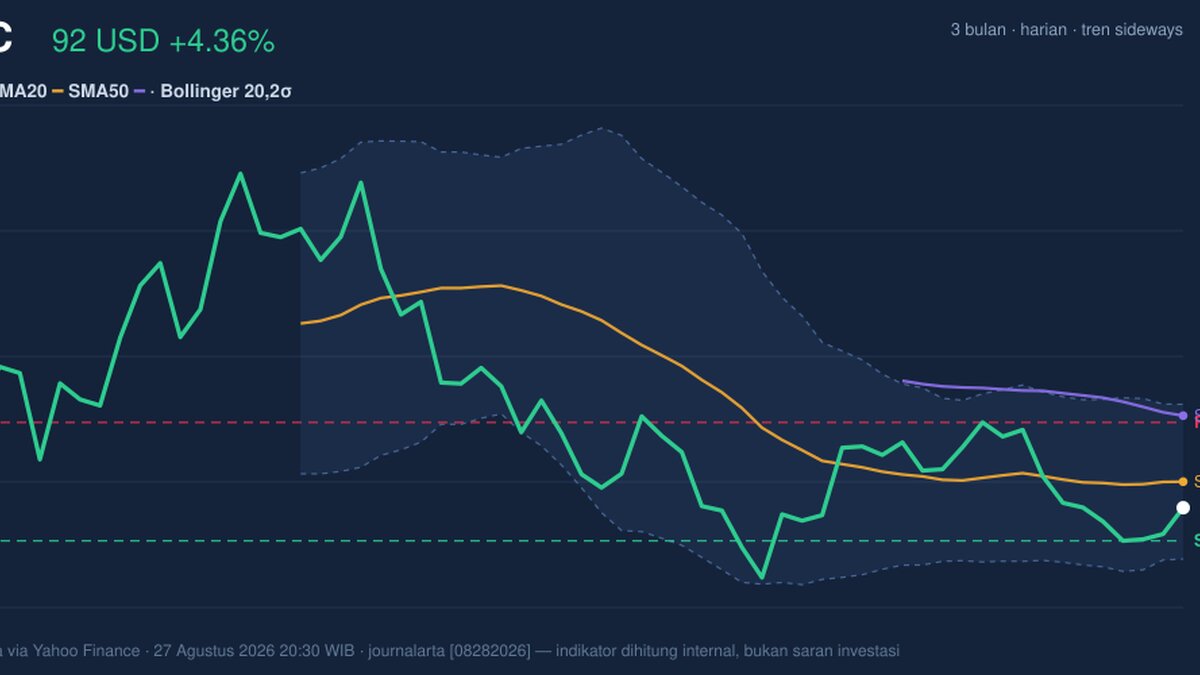
Intel is trading in a zone that matters to global chip investors: the stock is holding above recent support, but it remains below its short- and medium-term moving averages, a sign that the rebound is not yet a confirmed trend change.
Intel closed at 92.09 USD, up 4.36% from the previous close of 88.24, according to the latest Nasdaq-linked market data via Yahoo Finance. That jump looks strong on the surface, but the broader tape still tells a more cautious story. Over 5 days, the share price is essentially flat at -0.04%, and over 1 month it is up only 1.05%. In other words, the stock has bounced, but it has not yet escaped its wider holding pattern.
Trend & Price Action
The chart shows Intel sitting in a sideways trend, with the SMA20 at 95.90 and the SMA50 at 105.55. Price is still below the SMA20, which means the latest move has not reclaimed the short-term average that traders often watch as a line between weak recovery and genuine momentum. The fact that the SMA20 slope is only 0.10% over 5 days reinforces that this is not a strong directional move; it is more a pause than a breakout.
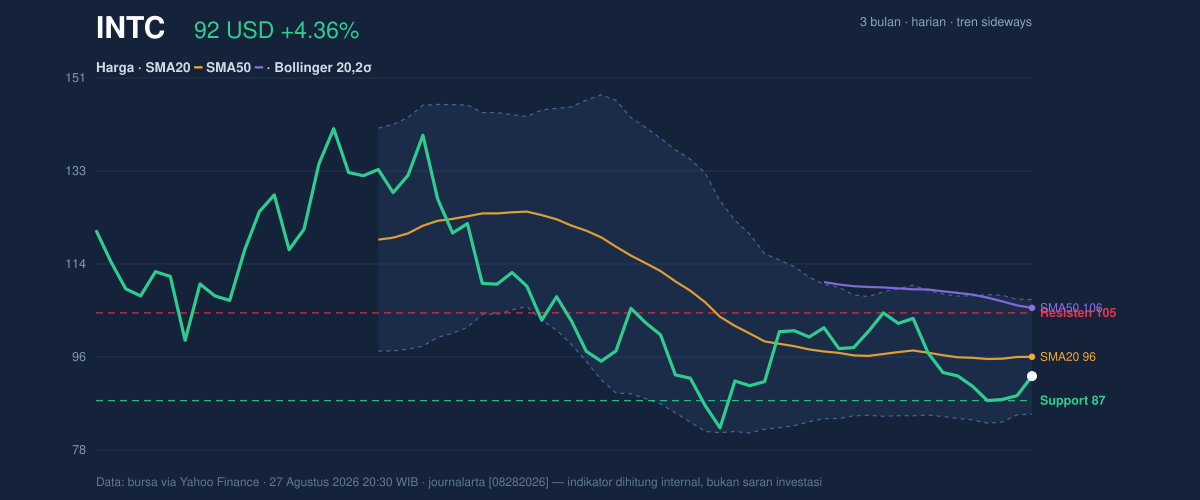
The stock is also well below the 3-month high of 142.35 and above the 3-month low of 81.79, placing it in the lower half of its recent range. That position matters because it suggests the market is still pricing Intel with caution, even after the latest bounce. The 20-hour support at 87.26 has so far acted as a floor, while 20-hour resistance at 104.56 remains the first meaningful ceiling. With price sitting at roughly 28% of the range, the stock is not near breakdown territory, but neither is it close to reclaiming control.
The Bollinger Bands add another layer. Price is below the middle band at 95.90, with the upper band at 107.22 and the lower band at 84.58. That puts Intel in the lower-middle part of its volatility envelope, which usually means the market is still digesting recent swings rather than establishing a clean trend. The %B at 33% shows price is closer to the lower band than the upper one, a sign that the recent bounce has not yet become broad-based strength. The band width of 23.6% is expanding, which signals higher volatility and the possibility of a larger move once the market chooses direction.
Oscillators & Momentum
Momentum is mixed, and that is the key message from the oscillator set. The RSI at 44.0 is neutral, not oversold enough to imply a deep washout, and not strong enough to confirm bullish momentum. The Stochastic %K at 31.0 and %D at 18.4 are also neutral, although the fast line above the slow line can hint at an early turn. That said, a neutral stochastic reading is not the same as a confirmed reversal; it simply suggests selling pressure has eased.
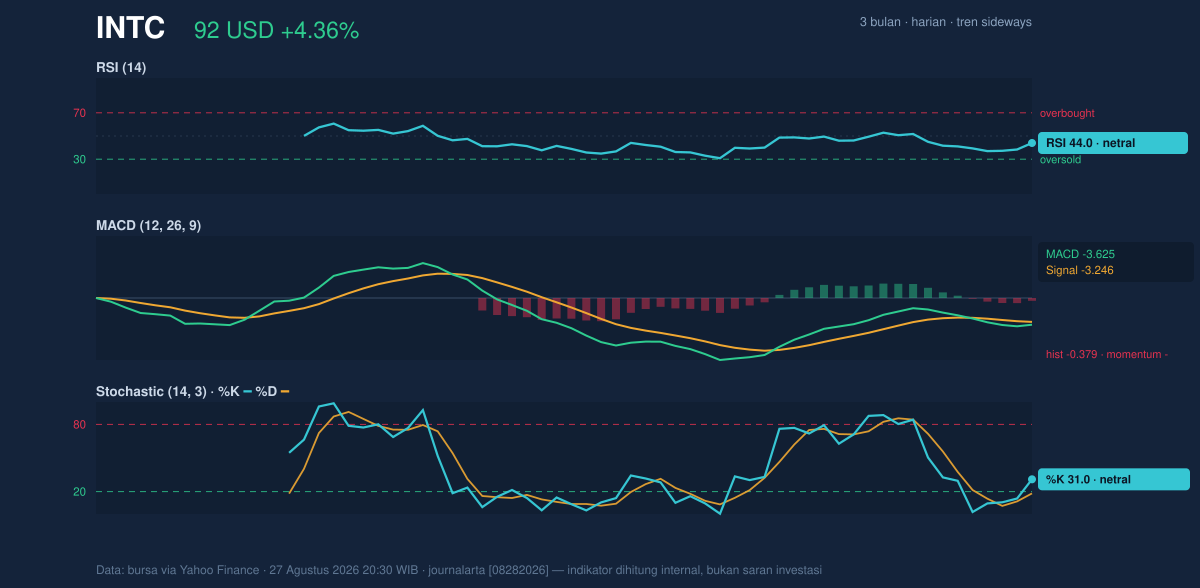
The more important signal comes from the MACD at -3.625, still below its signal line at -3.246, with a histogram of -0.379. For general readers, that means short-term price momentum is still weaker than the longer-term trend baseline. The negative histogram is especially important because it shows the bearish gap has not closed yet. So while the stock has bounced, the momentum engine underneath it is still running below neutral.
Volatility & Volume
Intel’s ATR(14) at 4.74, or 5.1% of price, points to high volatility. This matters because it suggests daily moves can be wide enough to push the stock through nearby support or resistance without much warning. In a high-ATR environment, false breaks become more common, and traders tend to wait for confirmation rather than react to one session alone.
Volume was 100,251,700, almost exactly 1.0× normal versus the 20-hour average of 103,154,775. That means the latest price rise was not backed by a surge in participation. The market moved, but it did so on ordinary turnover, which weakens the case for a decisive accumulation phase. The OBV is falling, and that is a notable divergence: on-balance volume tracks whether money is broadly flowing into or out of a stock, and a decline here implies the recent price bounce has not yet been matched by sustained buying pressure.
Key Levels & Scenarios
The immediate technical map is clear. 87.26 is the first support to watch, while 84.58 is the lower Bollinger band and a deeper downside marker. On the upside, 95.90 is the first reclaim level because it is the SMA20 and Bollinger middle band, and 104.56 is the nearest resistance. A move through 95.90 would improve the short-term structure; a move through 104.56 would be more meaningful because it would start to challenge the current sideways ceiling.
The current setup is therefore a range-bound stock with a weakly improving bounce, not a confirmed trend reversal. The positive daily move is real, but the indicators are not yet aligned enough to say buyers have taken control. The core message is that Intel is stabilizing, but the chart still needs a clean reclaim of its short-term averages before the rebound can be treated as durable.
Technical Verdict: HOLD (wait & see)
- Reason 1: The price is below SMA20 at 95.90 and far below SMA50 at 105.55, so the trend remains under pressure.
- Reason 2: MACD is negative and the histogram is below zero, showing momentum is still weak despite the bounce.
- Reason 3: Volume is only 1.0× normal and OBV is down, so the move lacks strong participation.
- Invalidation condition: this verdict is invalidated if price falls below 87.26, where near-term support sits.
- Ideal Entry Range: 87.26 to 95.90
- Exit Target: 104.56
- Stop Loss protection: 84.58
For non-traders, this means Intel has bounced, but the chart still needs proof that the recovery can last.
Summary Data INTC
| Last price | 92.09 USD |
| Change 1 day / 5 days / 1 month | 4.36% / -0.04% / 1.05% |
| Trend / MA-cross | sideways / none |
| SMA20 / SMA50 | 95.90 / 105.55 |
| RSI (14) / Stochastic %K | 44.0 / 31.0 |
| Bollinger %B / ATR | 33% / 4.74 |
| Support / Resistance 20 days | 87.26 / 104.56 |
| Data as of | 27 Agustus 2026 20:30 WIB |
Track INTC stock price daily: live levels, support/resistance and our full INTC analysis history.